Tracking stocks is easy.
It’s really just like…
juggling tennis balls…
annnd the balls are on fire…
annnnnd you’re wearing a blindfold…
Oh annnd, with one arm tied behind your back.
Yep, just like juggling.
There’s so much information you need to consume when you’re trying to make decisions about when to buy or sell.
Okay fine, there are ways to simplify it down.
But how do you know that a stock isn’t genuinely tanking or whether its a fake out and a chance to capture some real value.
You have to read stuff right? Go through the news? Right?
This.
Takes.
Time!
What if…you could have you very own searchable database for stock news?
You could list the websites you wanted to track.
Have it automatically updated each day.
And search it for relevant stuff.
Sound good to you?
Well, say hello to IBM’s AI powered beast…Watson Discovery!
Watson Discovery allows you to upload a bunch of documents and search through them seamlessly using Natural Language Processing. It’s got a whole bunch of applications from uncovering insights in legal documents to monitoring trends and surfacing patterns in invoicing.
Quite possibly one of the best uses for it, however is using it to keep track of stock news.
This is primary because of its true killer feature…a built in web crawler which allows you to automatically scrape data from ANY website and use it as part of your dataset. This means you can key in the websites you want to keep track of and have your dataset automatically processed for querying and analysis by the Watson Discovery engine!
This post goes through how to build a stock news crawler using just a couple of links and Watson Discovery. By the end you’ll have a fully featured a searchable data collection that you can use to keep up to date with your stocks. Ready to build it?
Open up a web browser and kick off with step one below!
1. Setup a Service
As usual the first part of setting up any cloud service is to spin up a new instance.
First up head on over to the IBM cloud catalog.
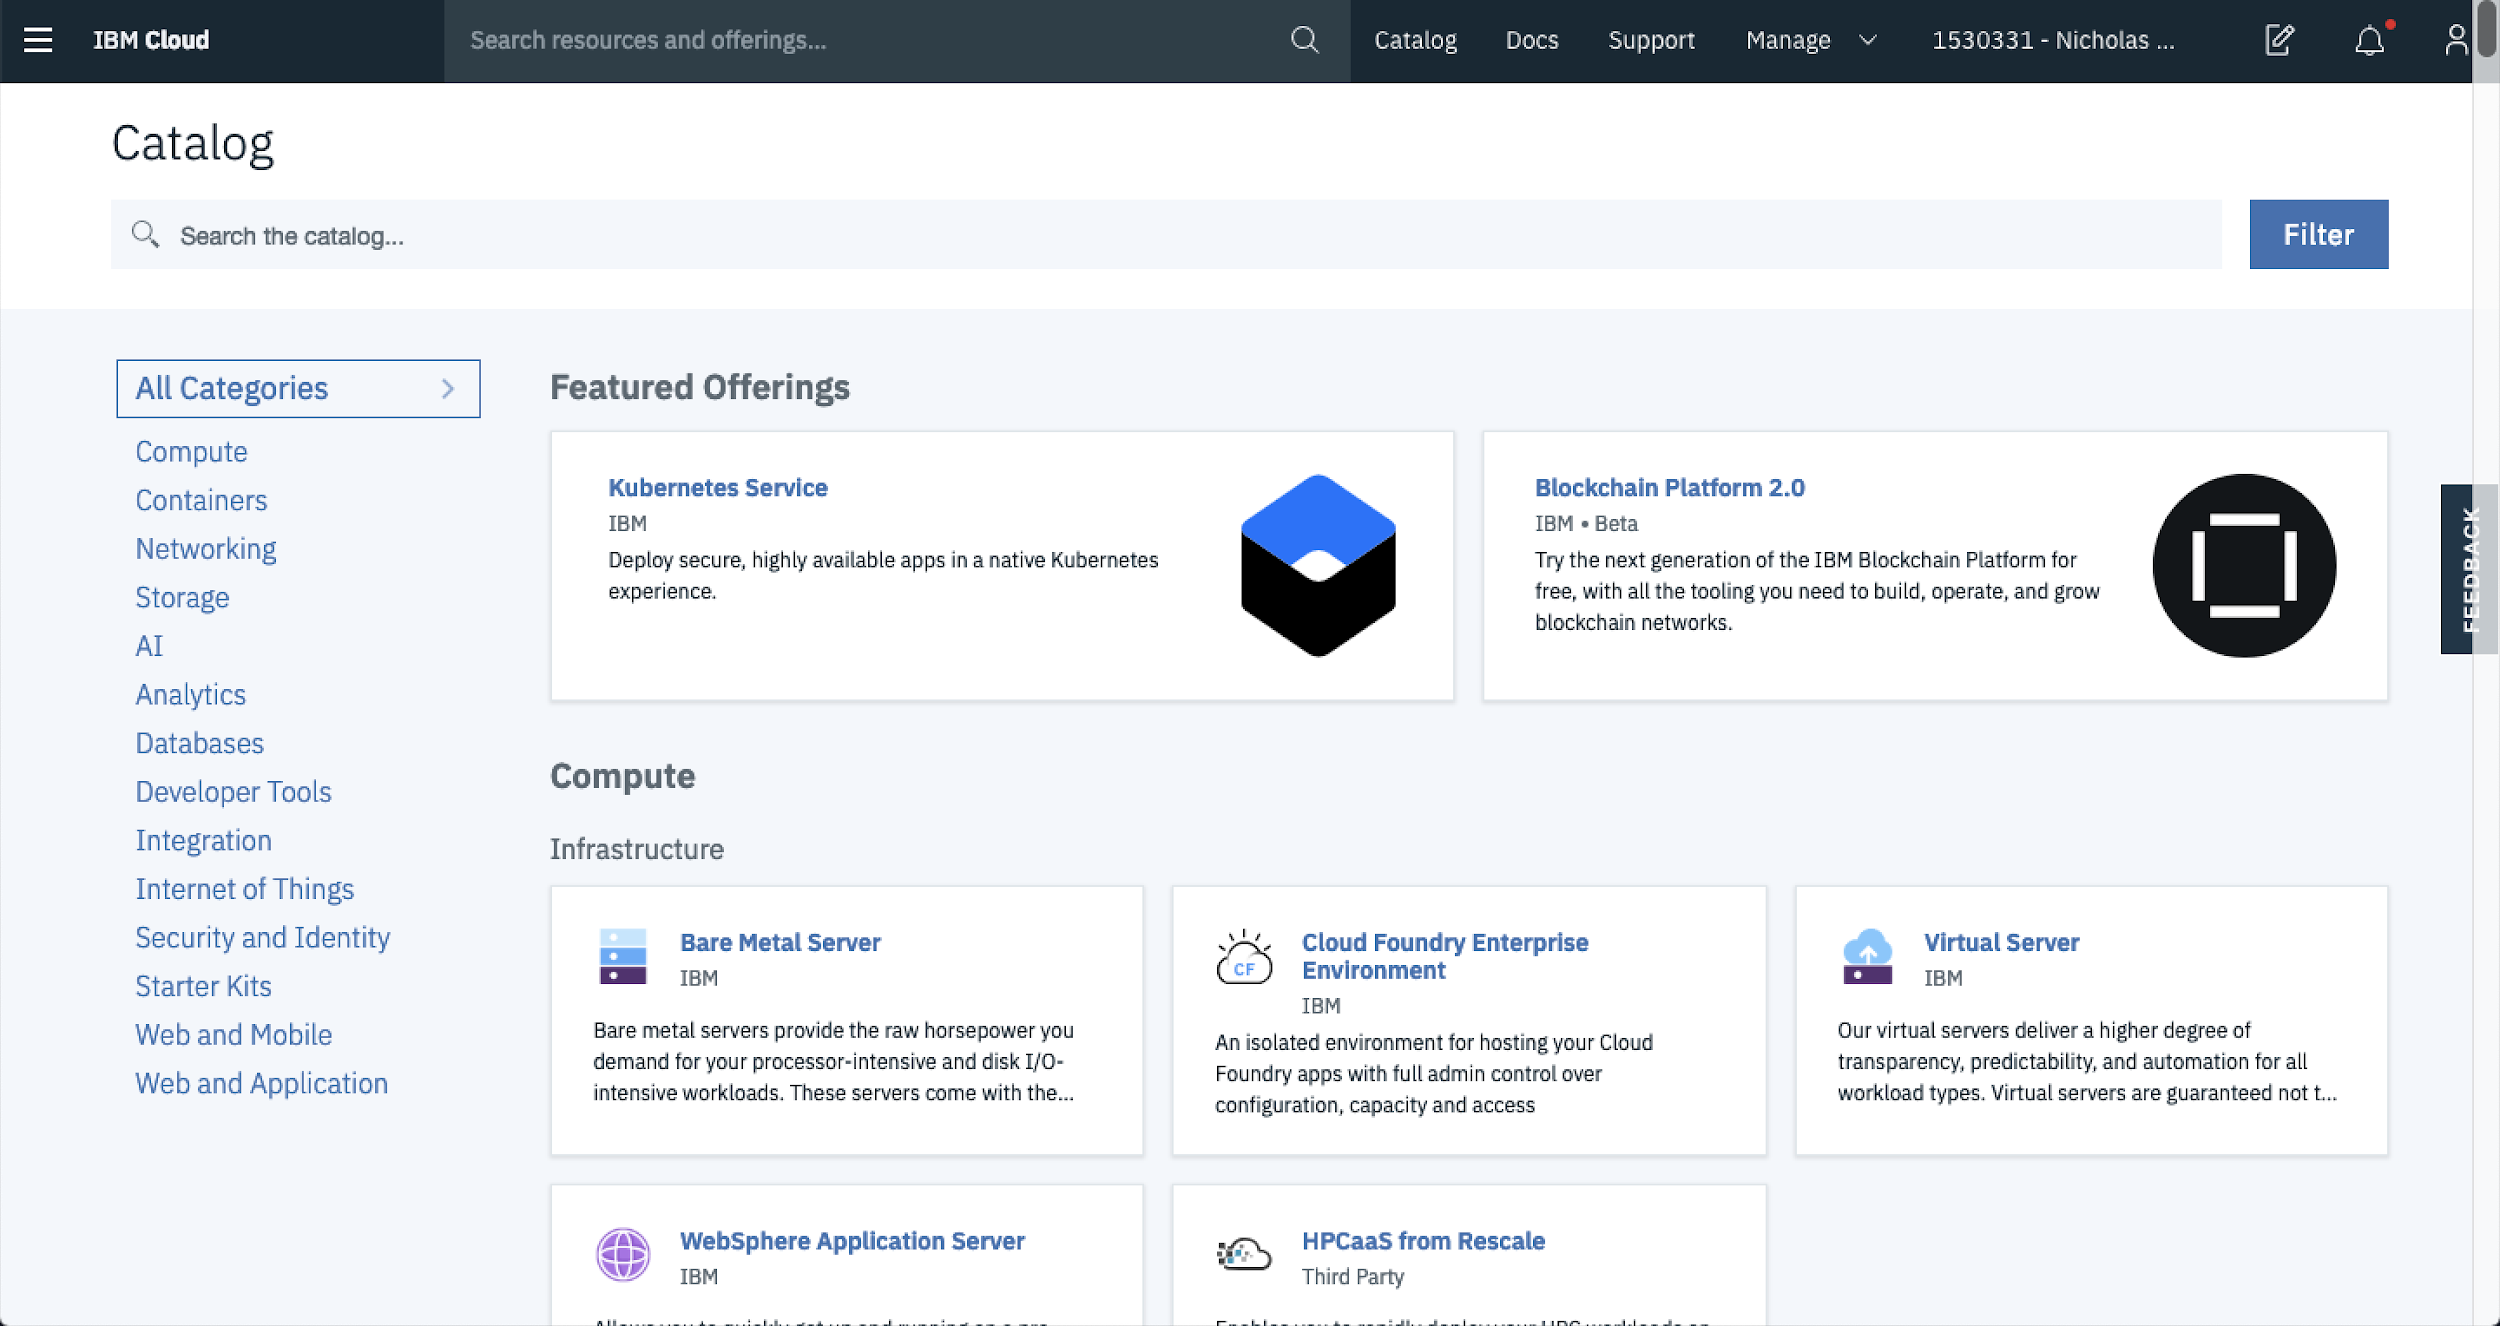
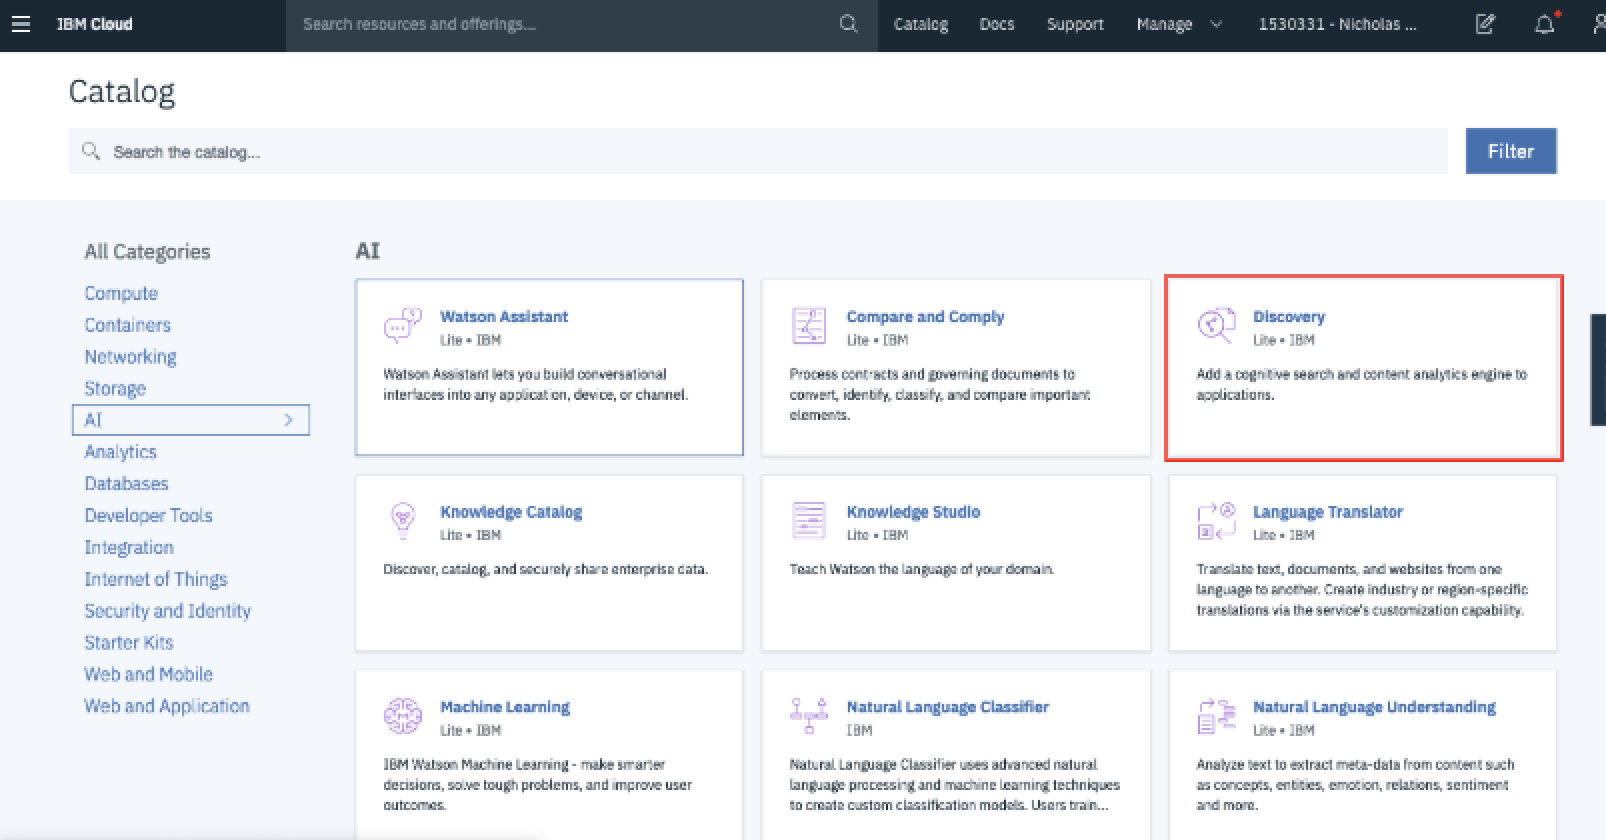
Then from here you can spin up a new Watson Discovery service instance. To do this, click AI from the side bar and then select Watson Discovery.
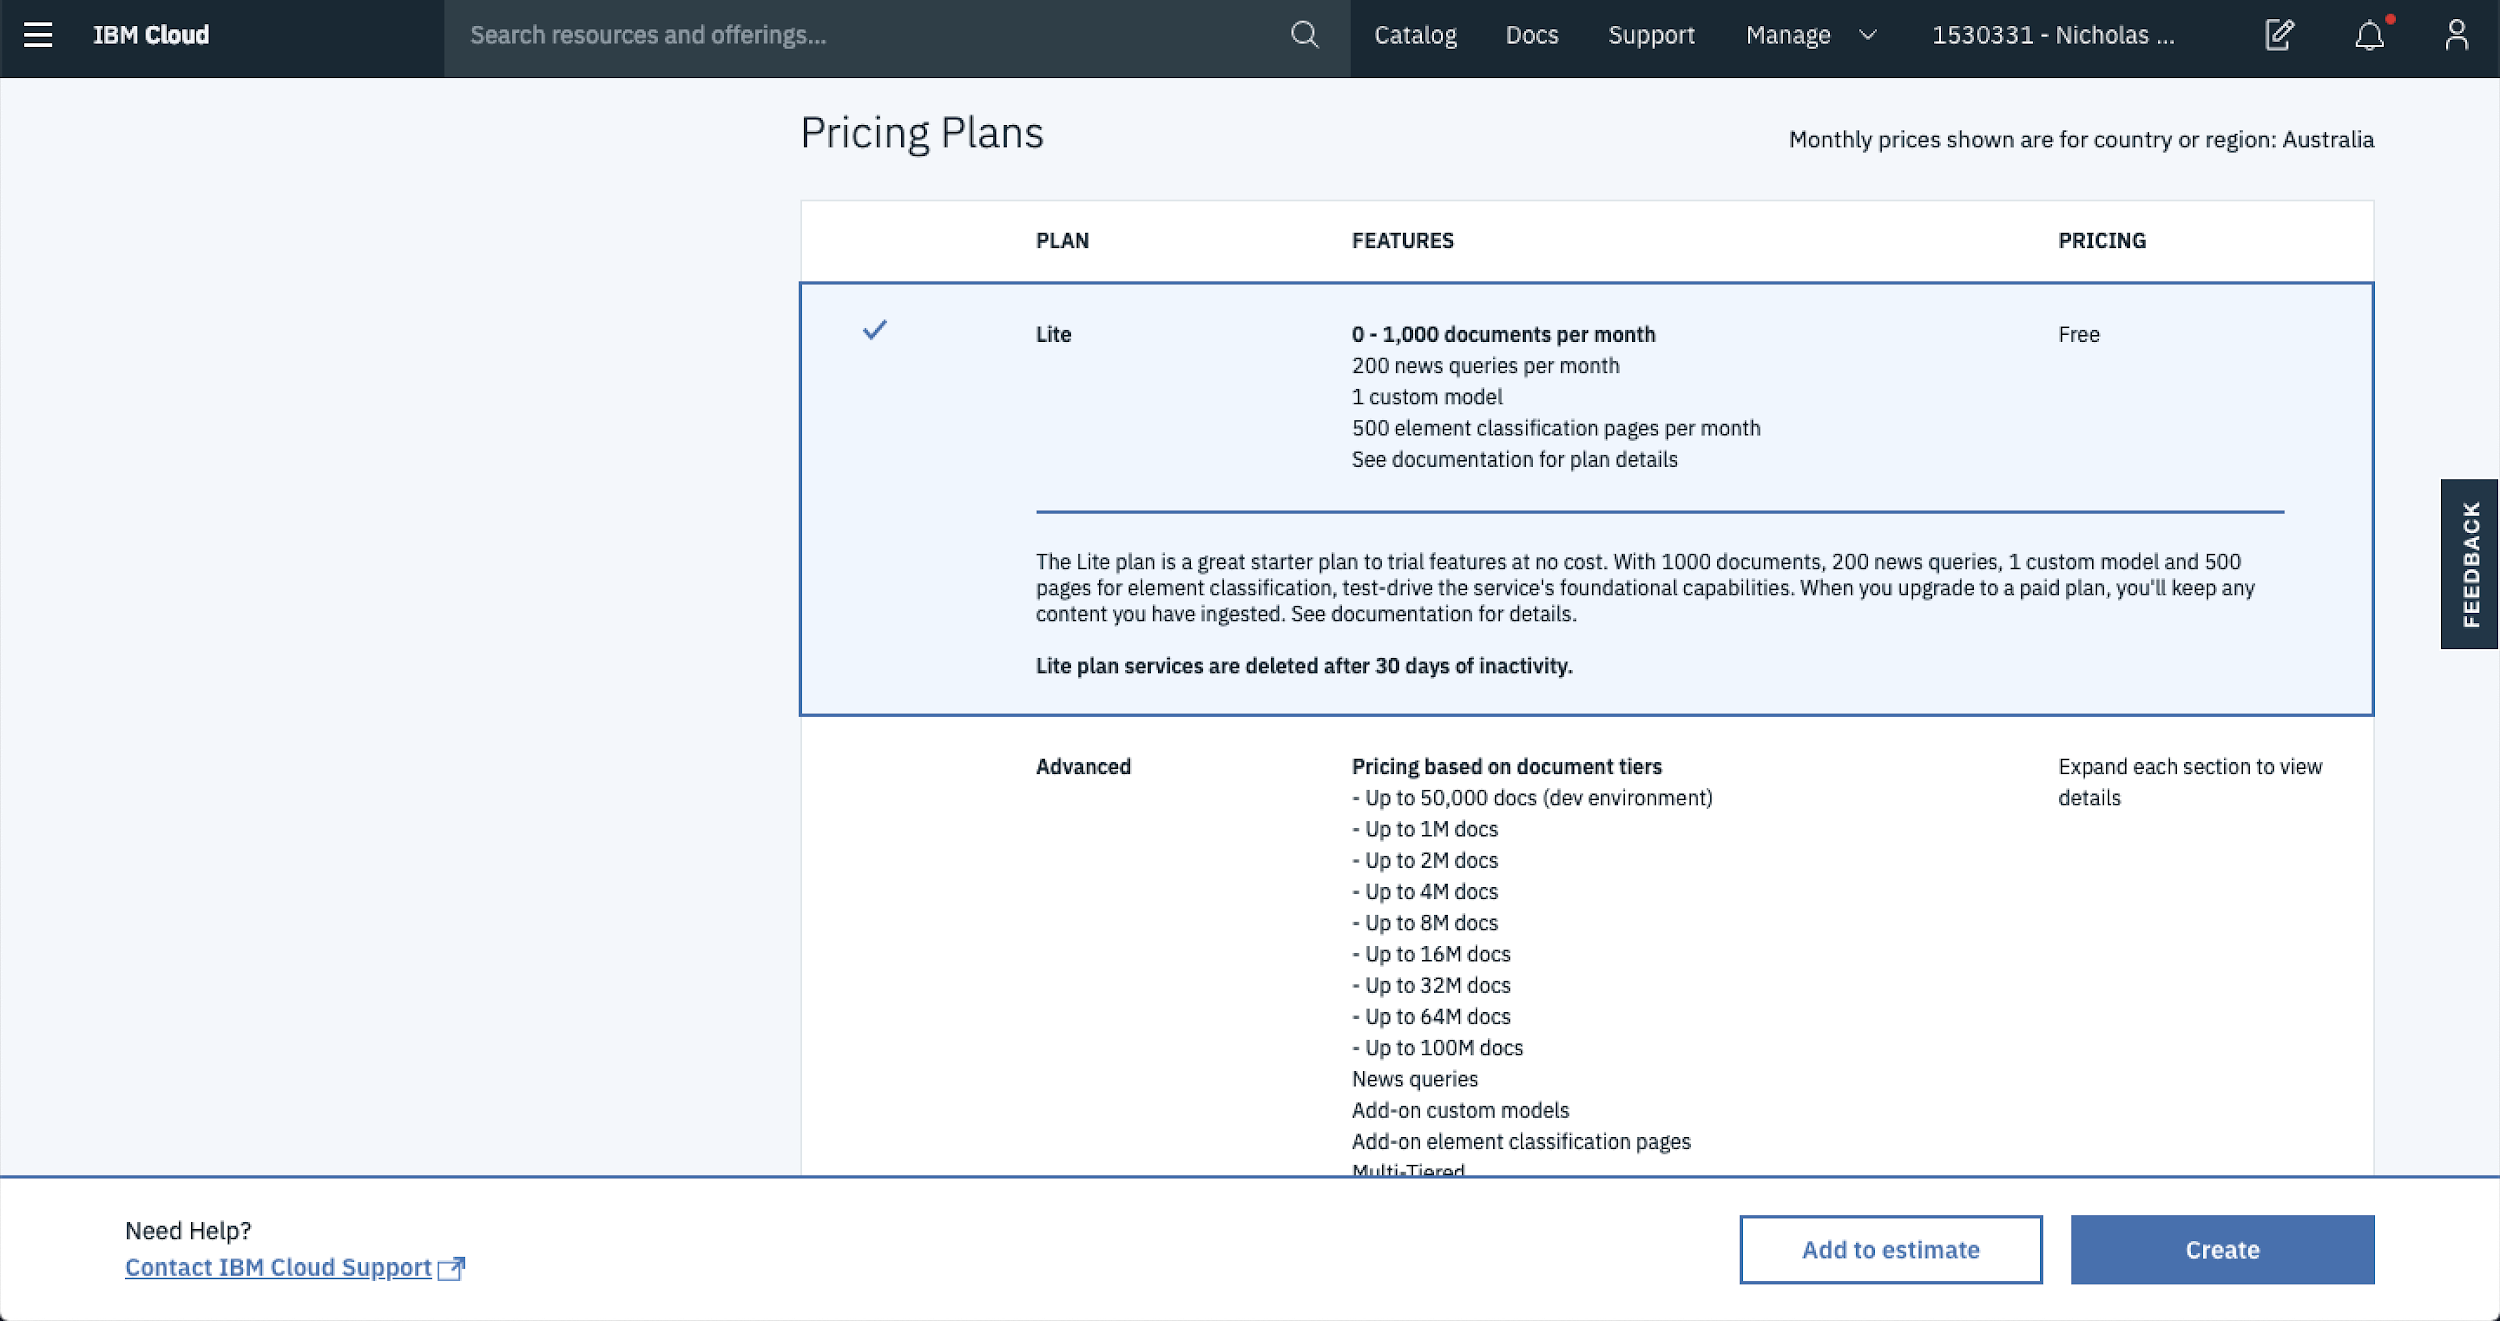
From here you can rename your service, select the resource location and select the type of plan you would like to use.
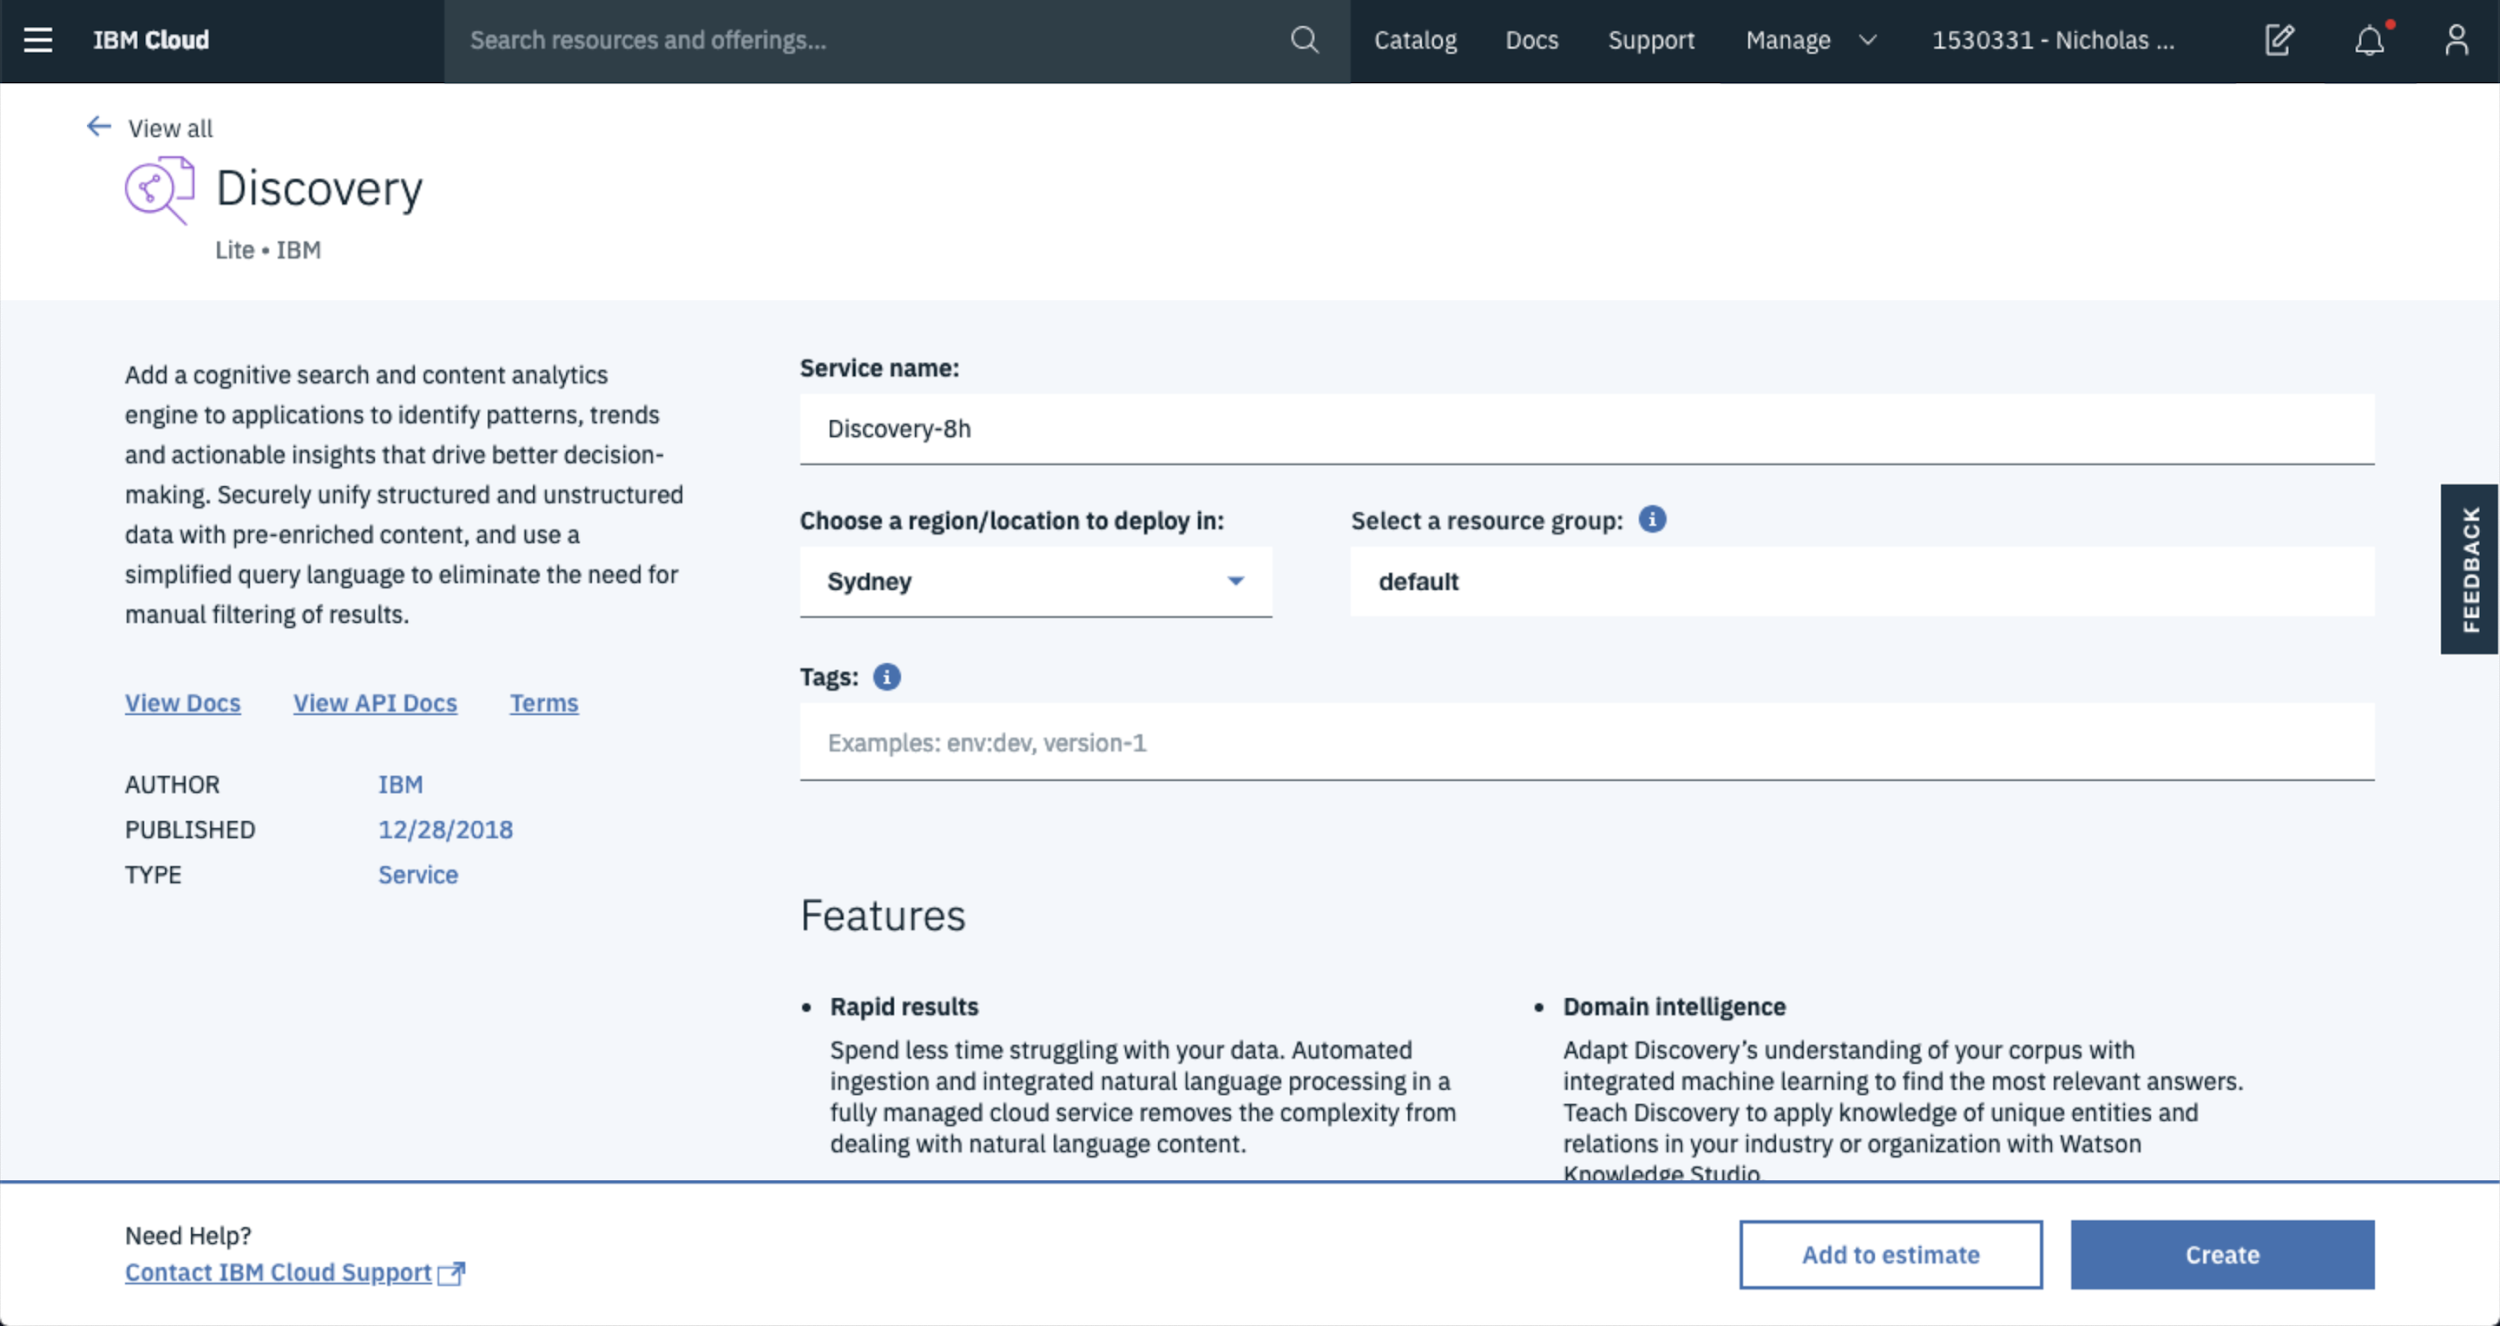
In this case the Lite plan is more than sufficient to get started so choose that for now. Later on if you decide that more capacity is required then you’re able to bump up your plan.
Once you’re happy with all of the settings hit Create Service, this will start spinning up a service in the background. Once that’s done you’ll be redirected to a landing page where you can start managing things.
From here, hit Launch Tool and you’ll be taken to the main Watson Discovery dashboard.
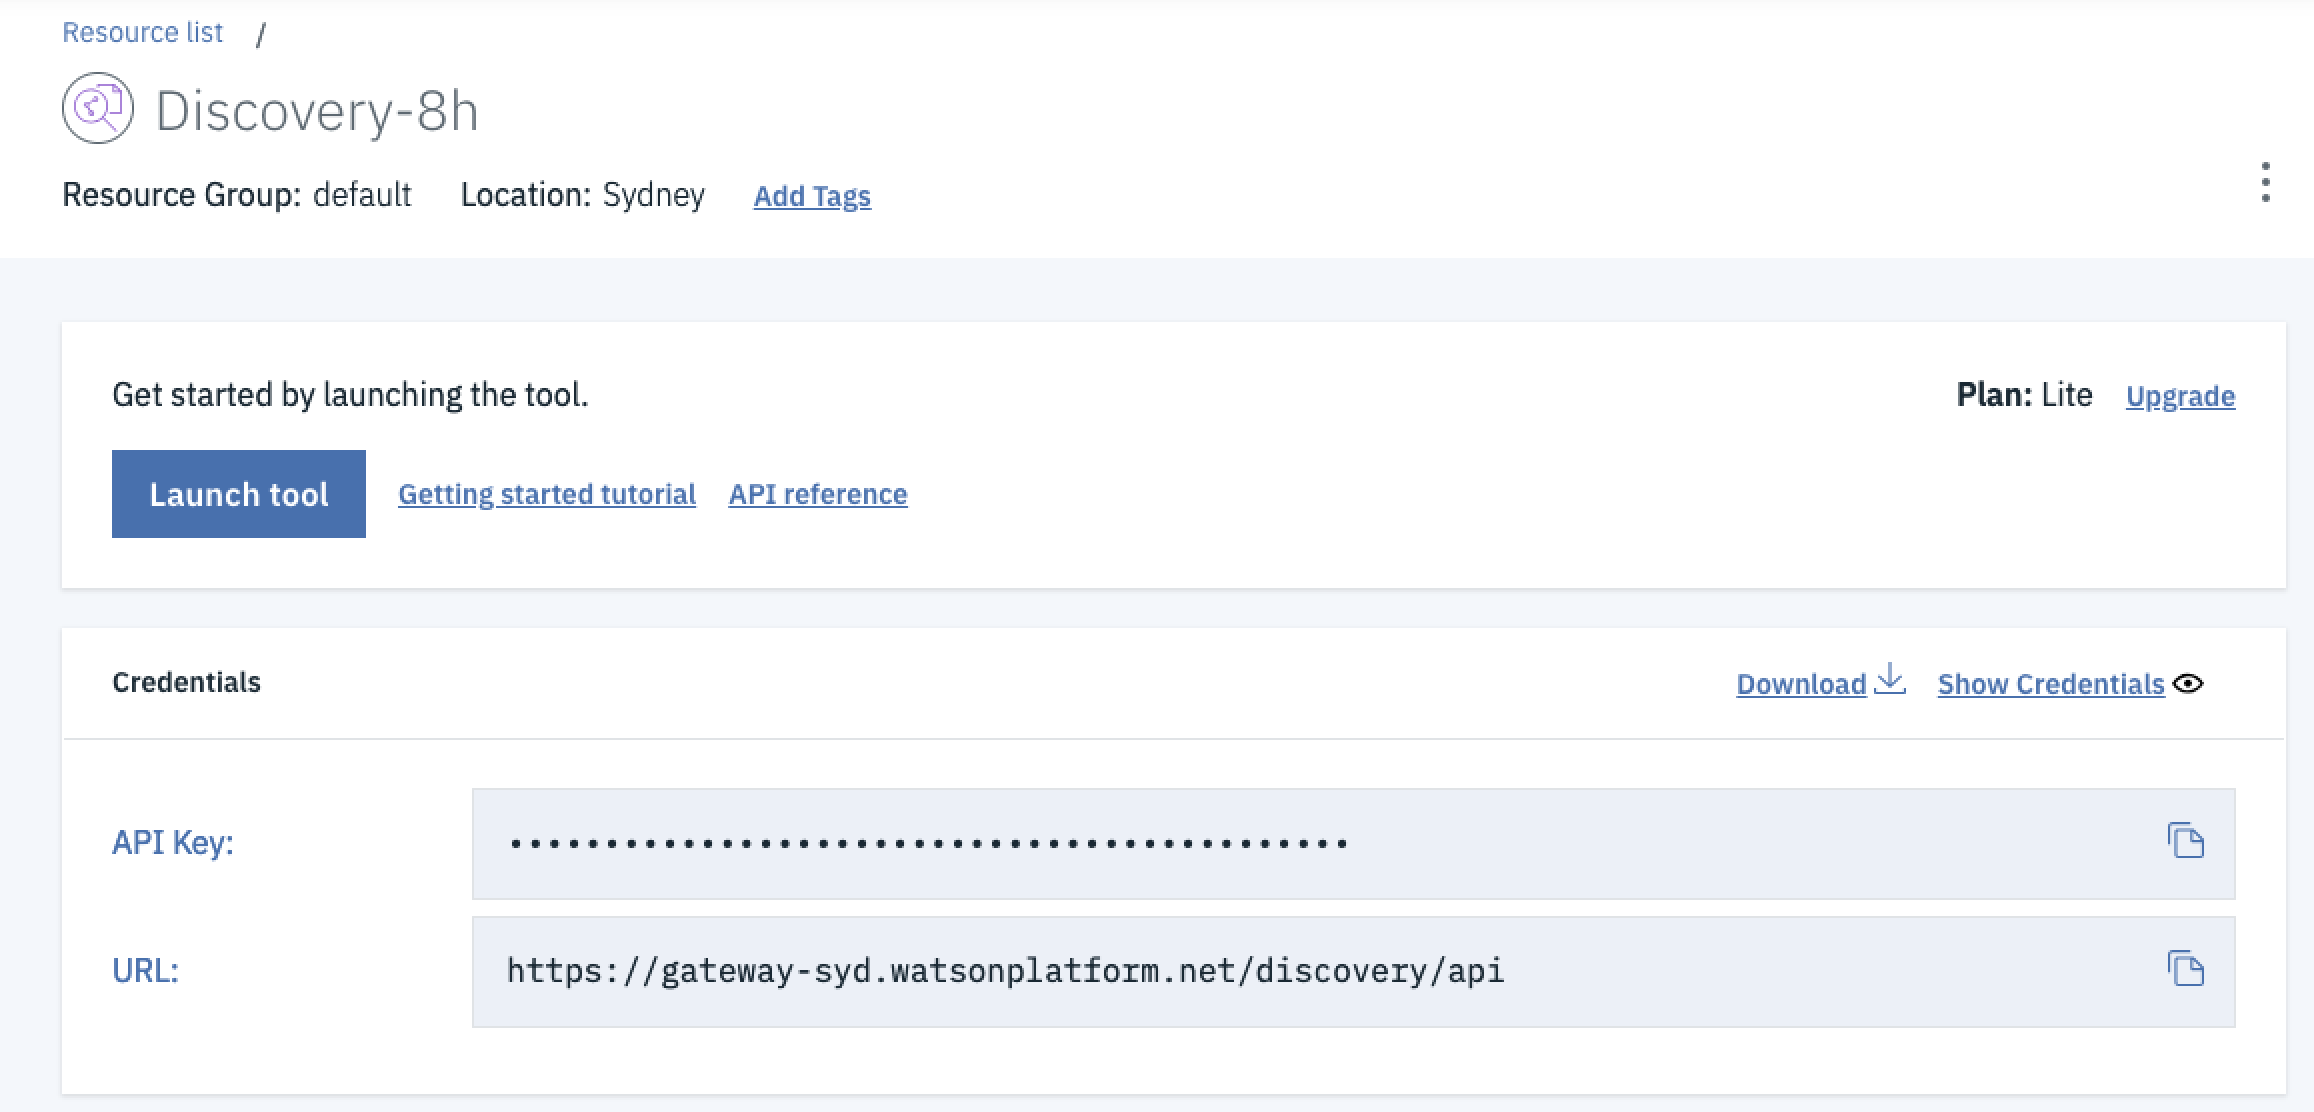
The dashboard is where you’ll do the majority of the work for this runthrough. From here you’re able to manage all of your document collections and navigate around through the Watson Discovery platform.
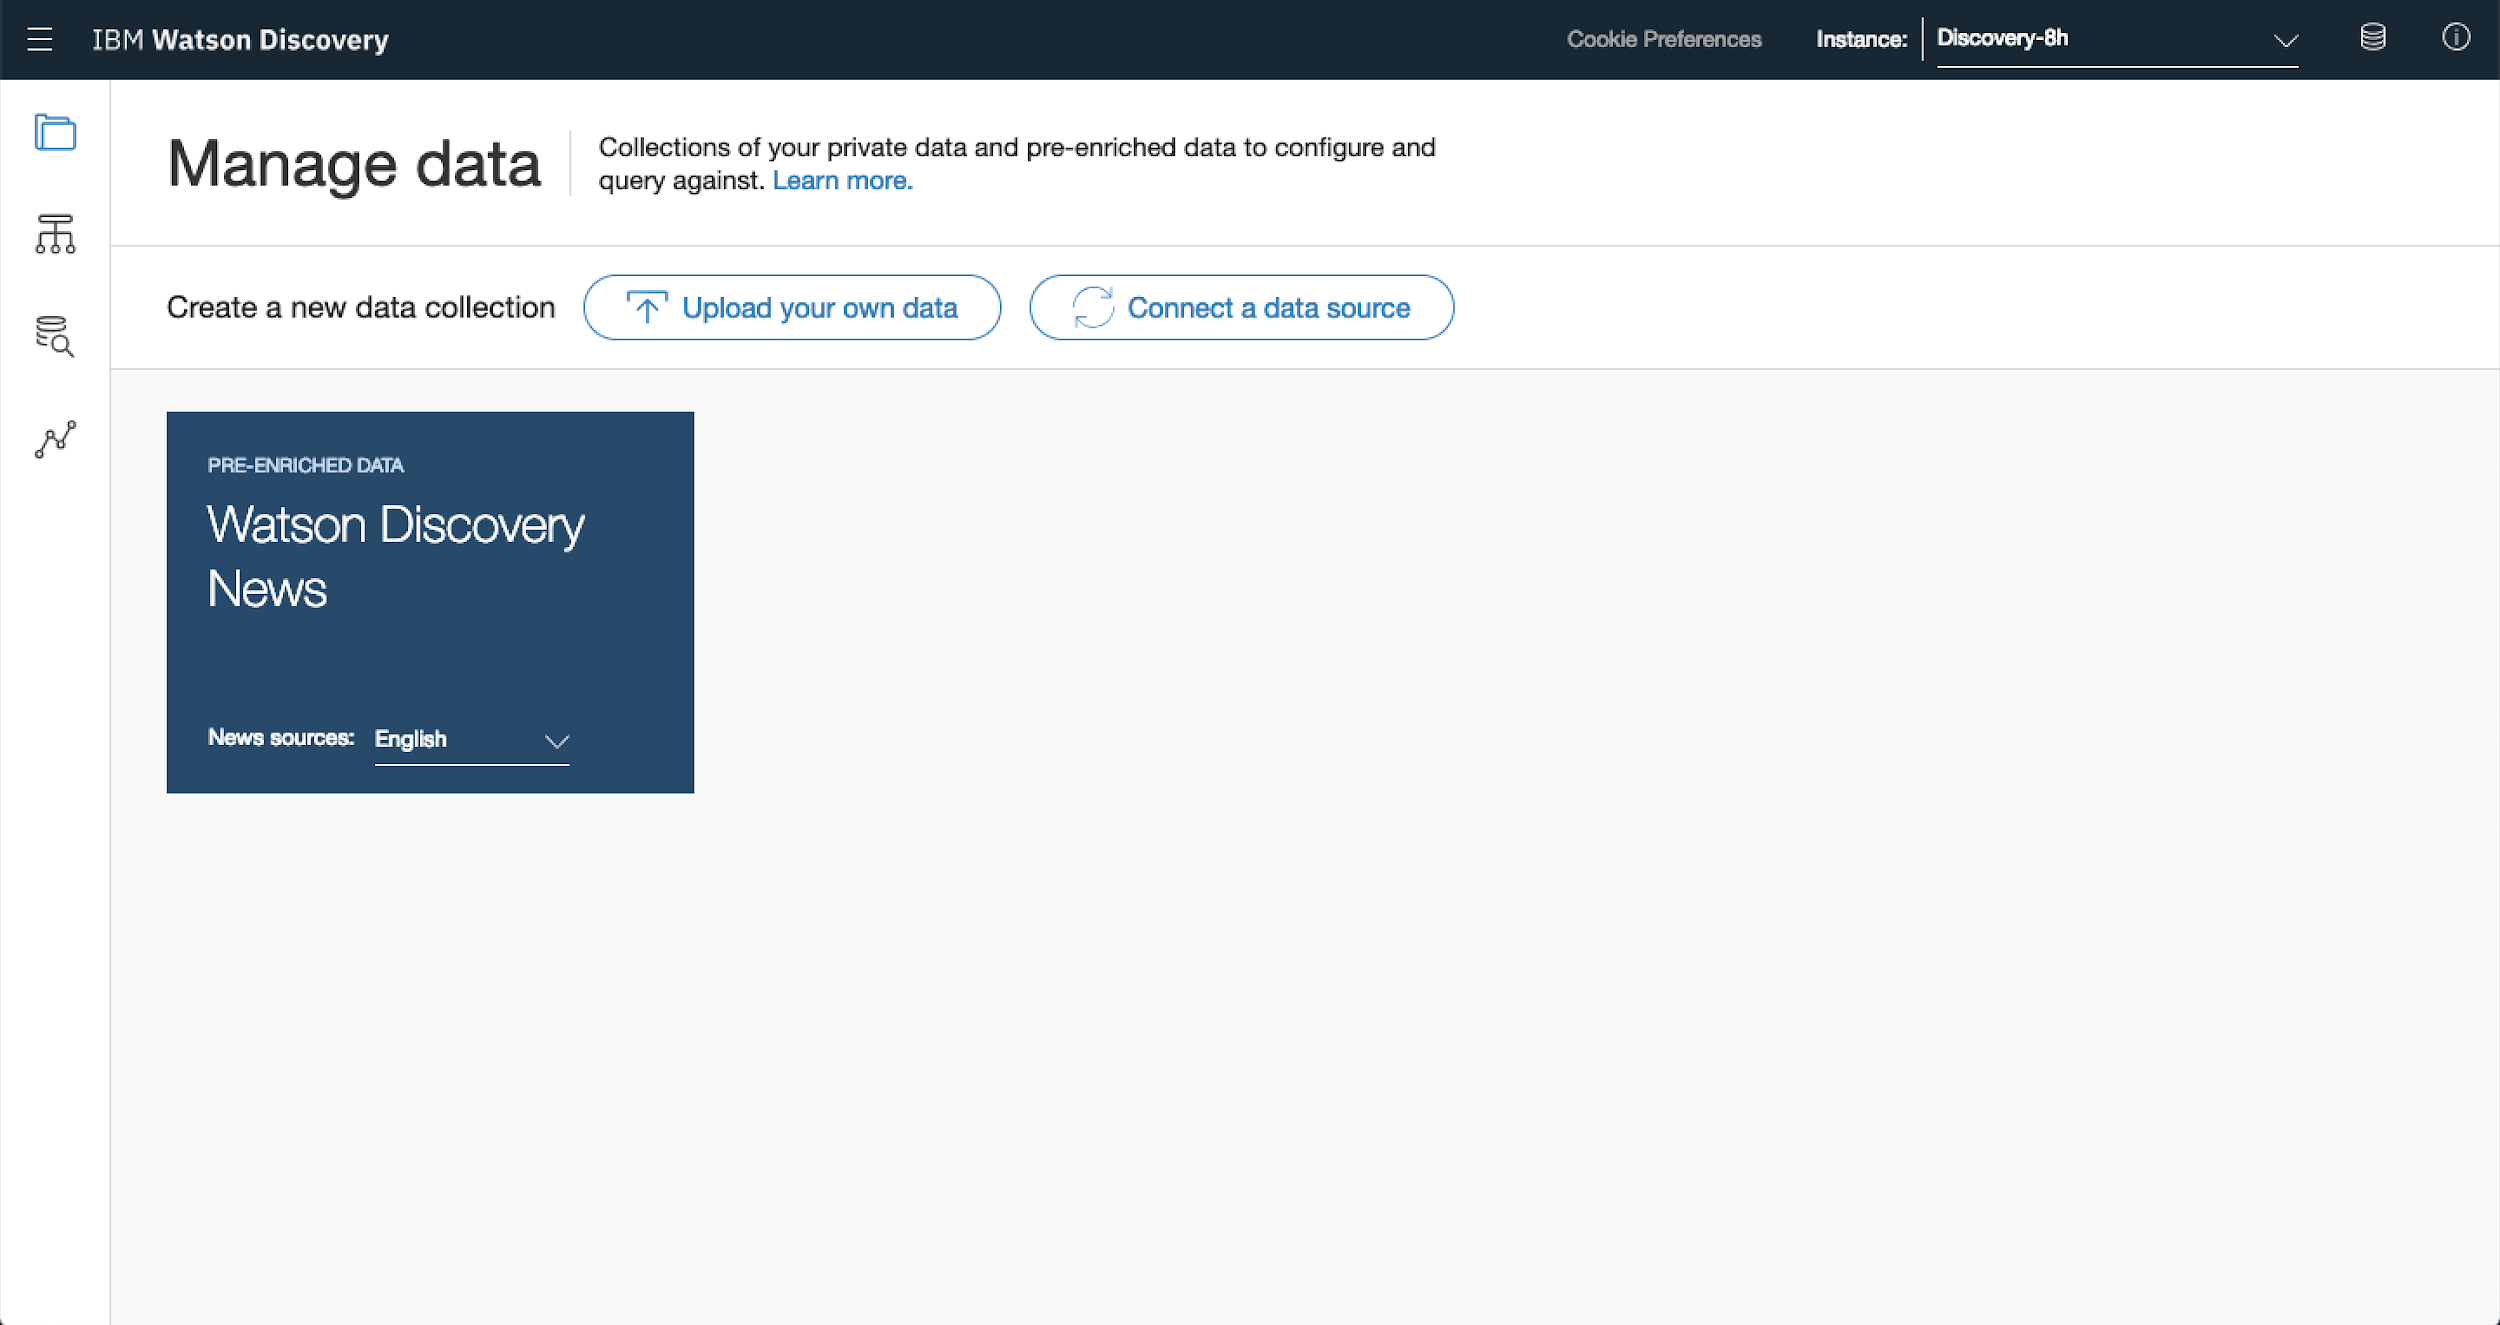
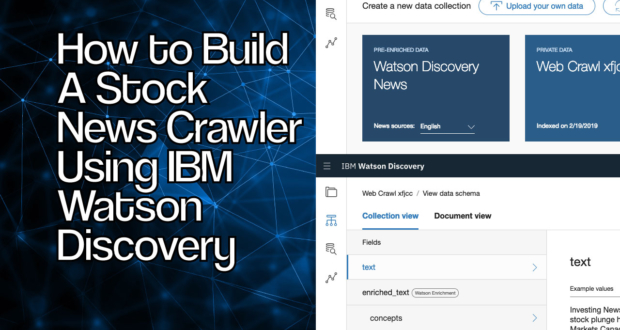
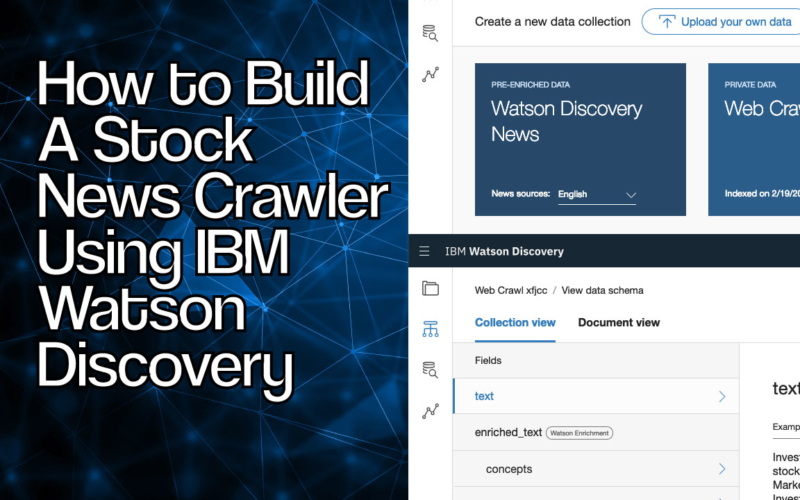
2. Connect Your Data Via Web Crawler
Watson Discovery manages documents in collections. Really a collection can be a bunch of different files of varying file type. One of the most powerful components of this setup is that you’re able to collect documents automatically from the web but also load up your own documents (including PDF, HTML, JSON, Word, Excel, PowerPoint, PNG, TIFF, JPG).
In this case you’ll tap into the Web Crawler built into Watson Discovery to collect data from financial websites to analyse stock data.
To get started, select Connect To A Data Source from the dashboard page you ended with in Step 1. You’ll be prompted to see if you want to change to an alternate plan. Select Set up with current plan.

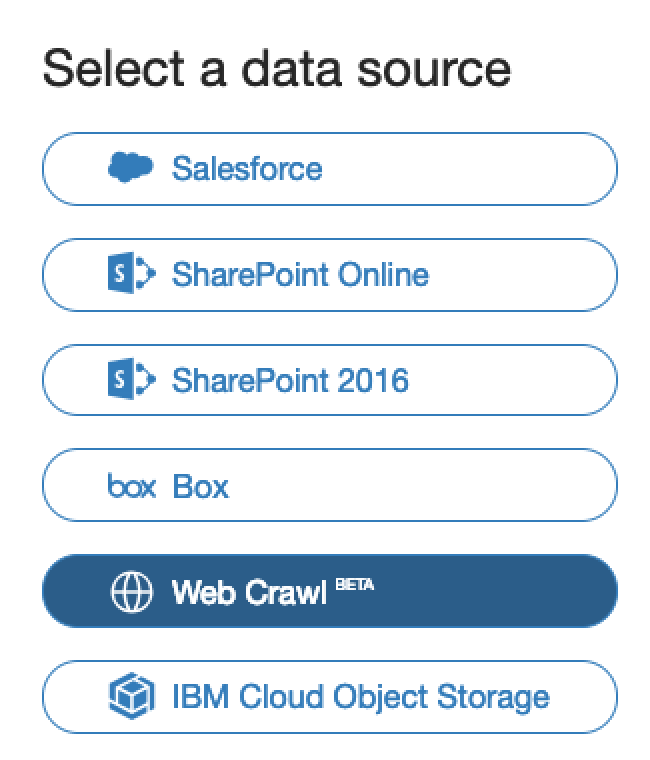
From here you have a number of different options to connect to including Salesforce, Sharepoint, Box, IBM Cloud storage and…my personal favourite Web Crawl.
You’re going to ignore the majority of these sources for now and focus on the web crawl.
Why?
Well, because it’s ridiculously powerful for connecting to data sources on the web. The Web Crawl data source let’s you scrape data from literally any website out there, you can enter a group of links and set Watson Discovery to periodically scan those sites and retrieve data.
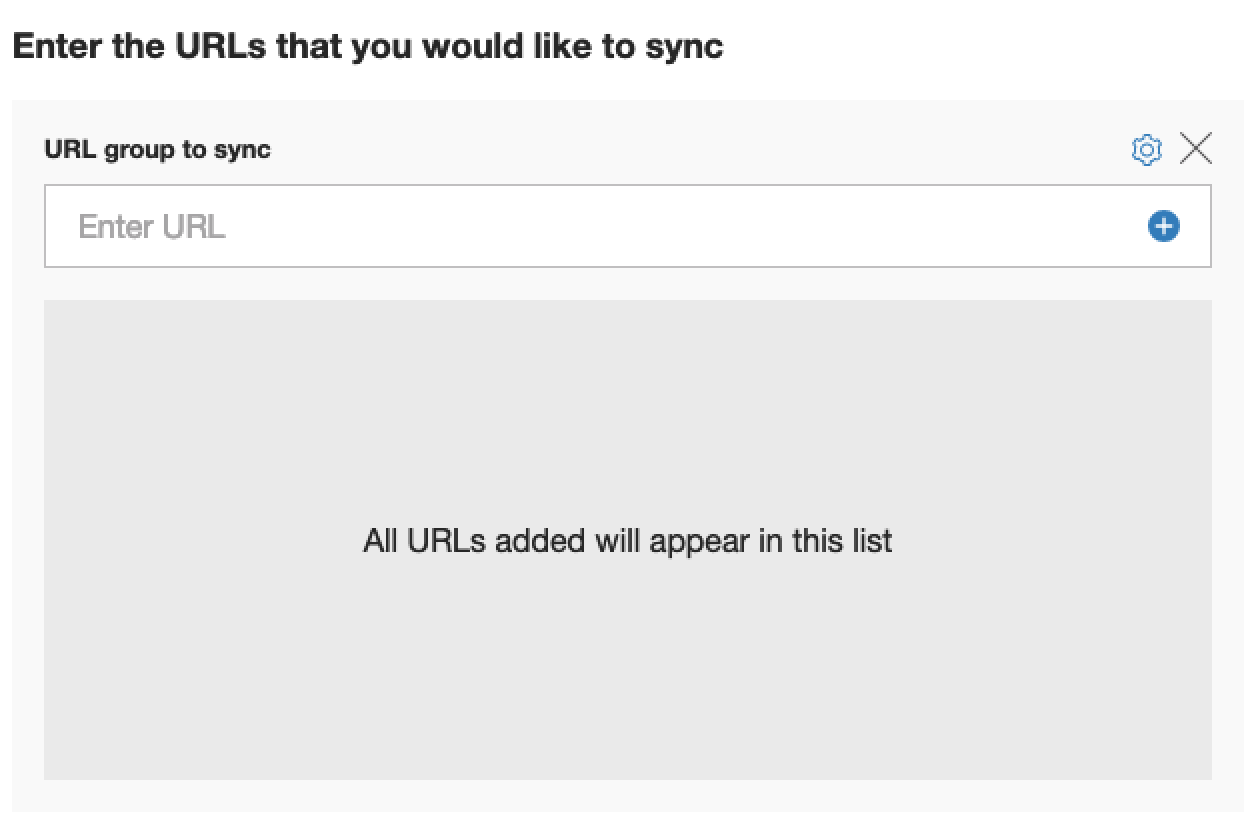
To set this up, select Web Crawl. From here you’ll be taken to the configuration page where you’re able to list the websites you want to track as well as how frequently you want to track them.
The first drop down allows you to change the frequency of the crawl. There’s a few options here ranging from once a week to once every five minutes. So that you’re not bombarding the sites with traffic, select once a week to refresh your data weekly.
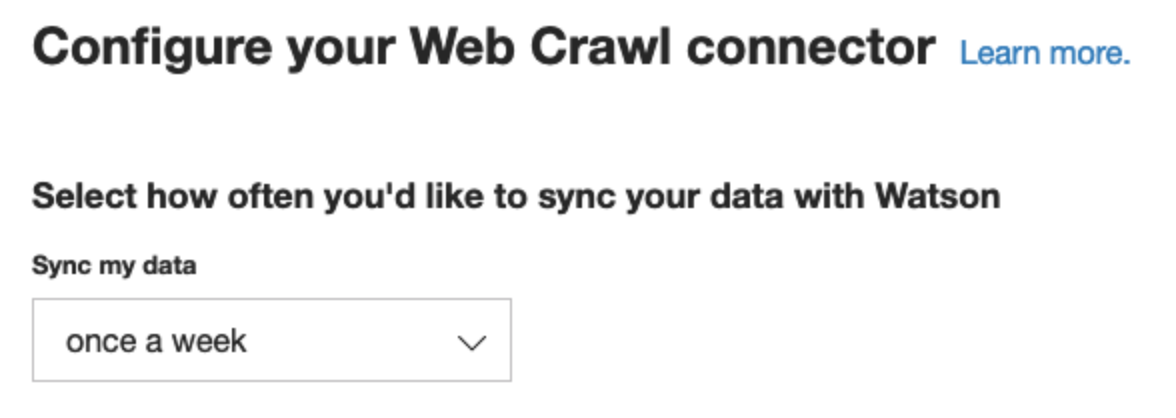
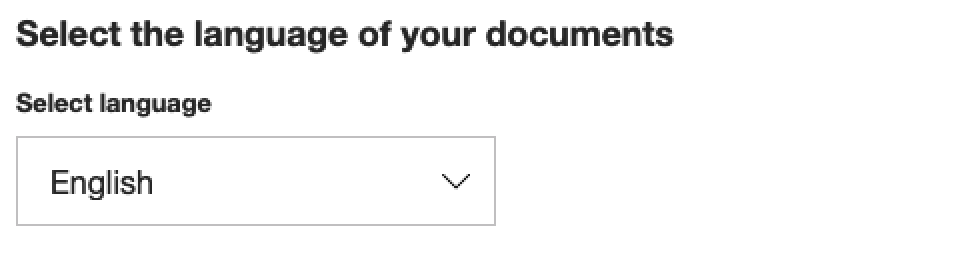
You can then change the language of the sites you’re scanning. This is especially useful if you’re crawling non-english websites. In this case you’ll be scanning English websites, so leave that as is for now.
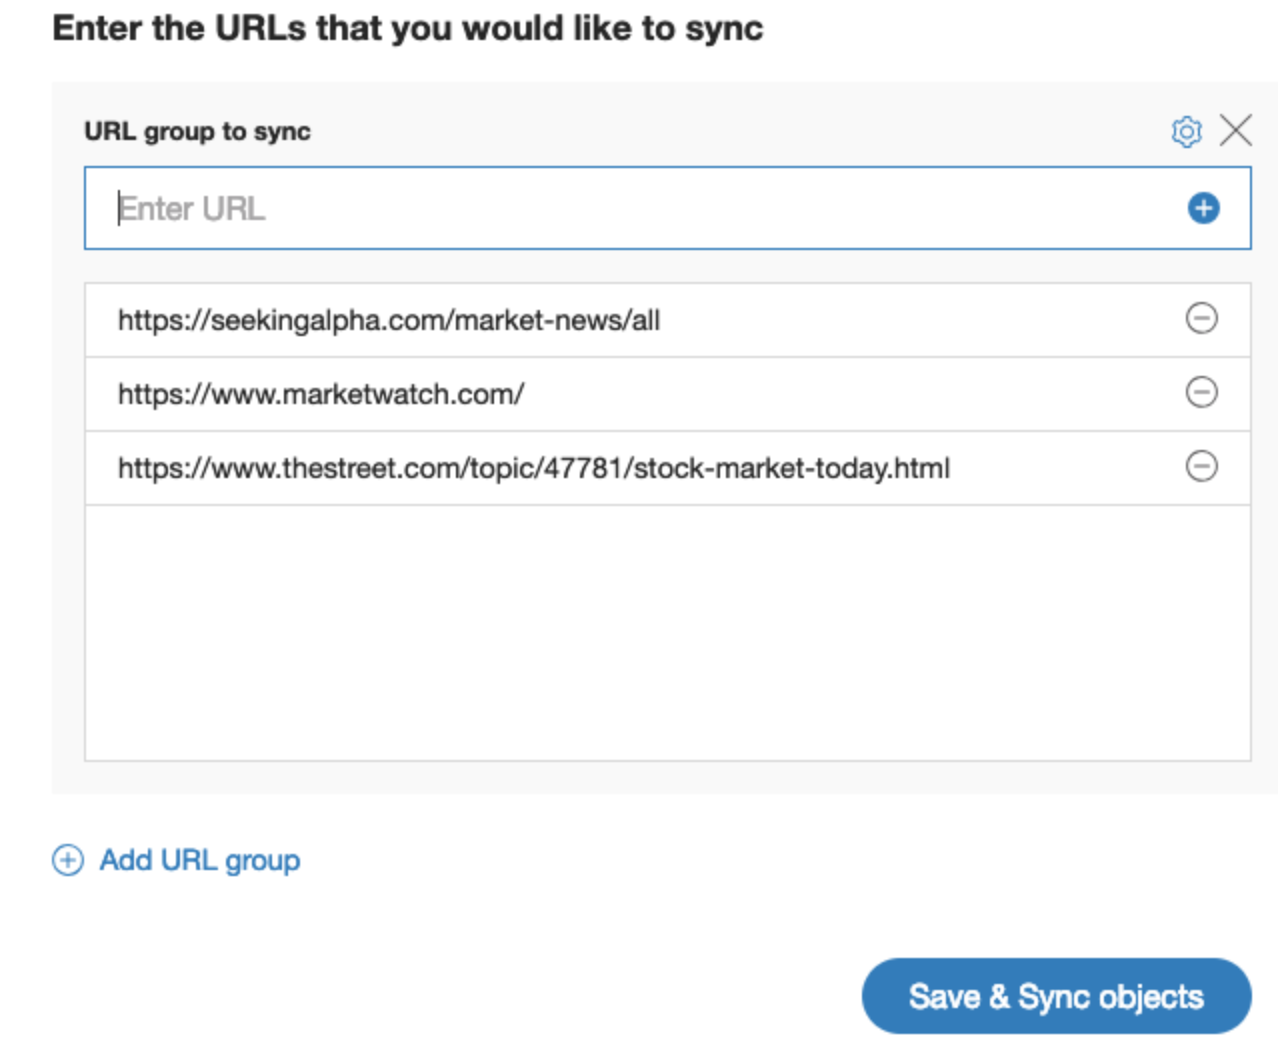
And finally, add in the URLs that you’d like to track. You can add as many or as little as you’d like but just keep in mind that higher number of urls means a longer wait time as Watson Discovery needs to process the data.
Here are a few that might help you get started
- https://seekingalpha.com/market-news/all
- https://www.marketwatch.com/
- https://www.thestreet.com/topic/47781/stock-market-today.html
Once you’ve got all of your URLs entered in the sync box, select Save and Sync objects to start processing the data.
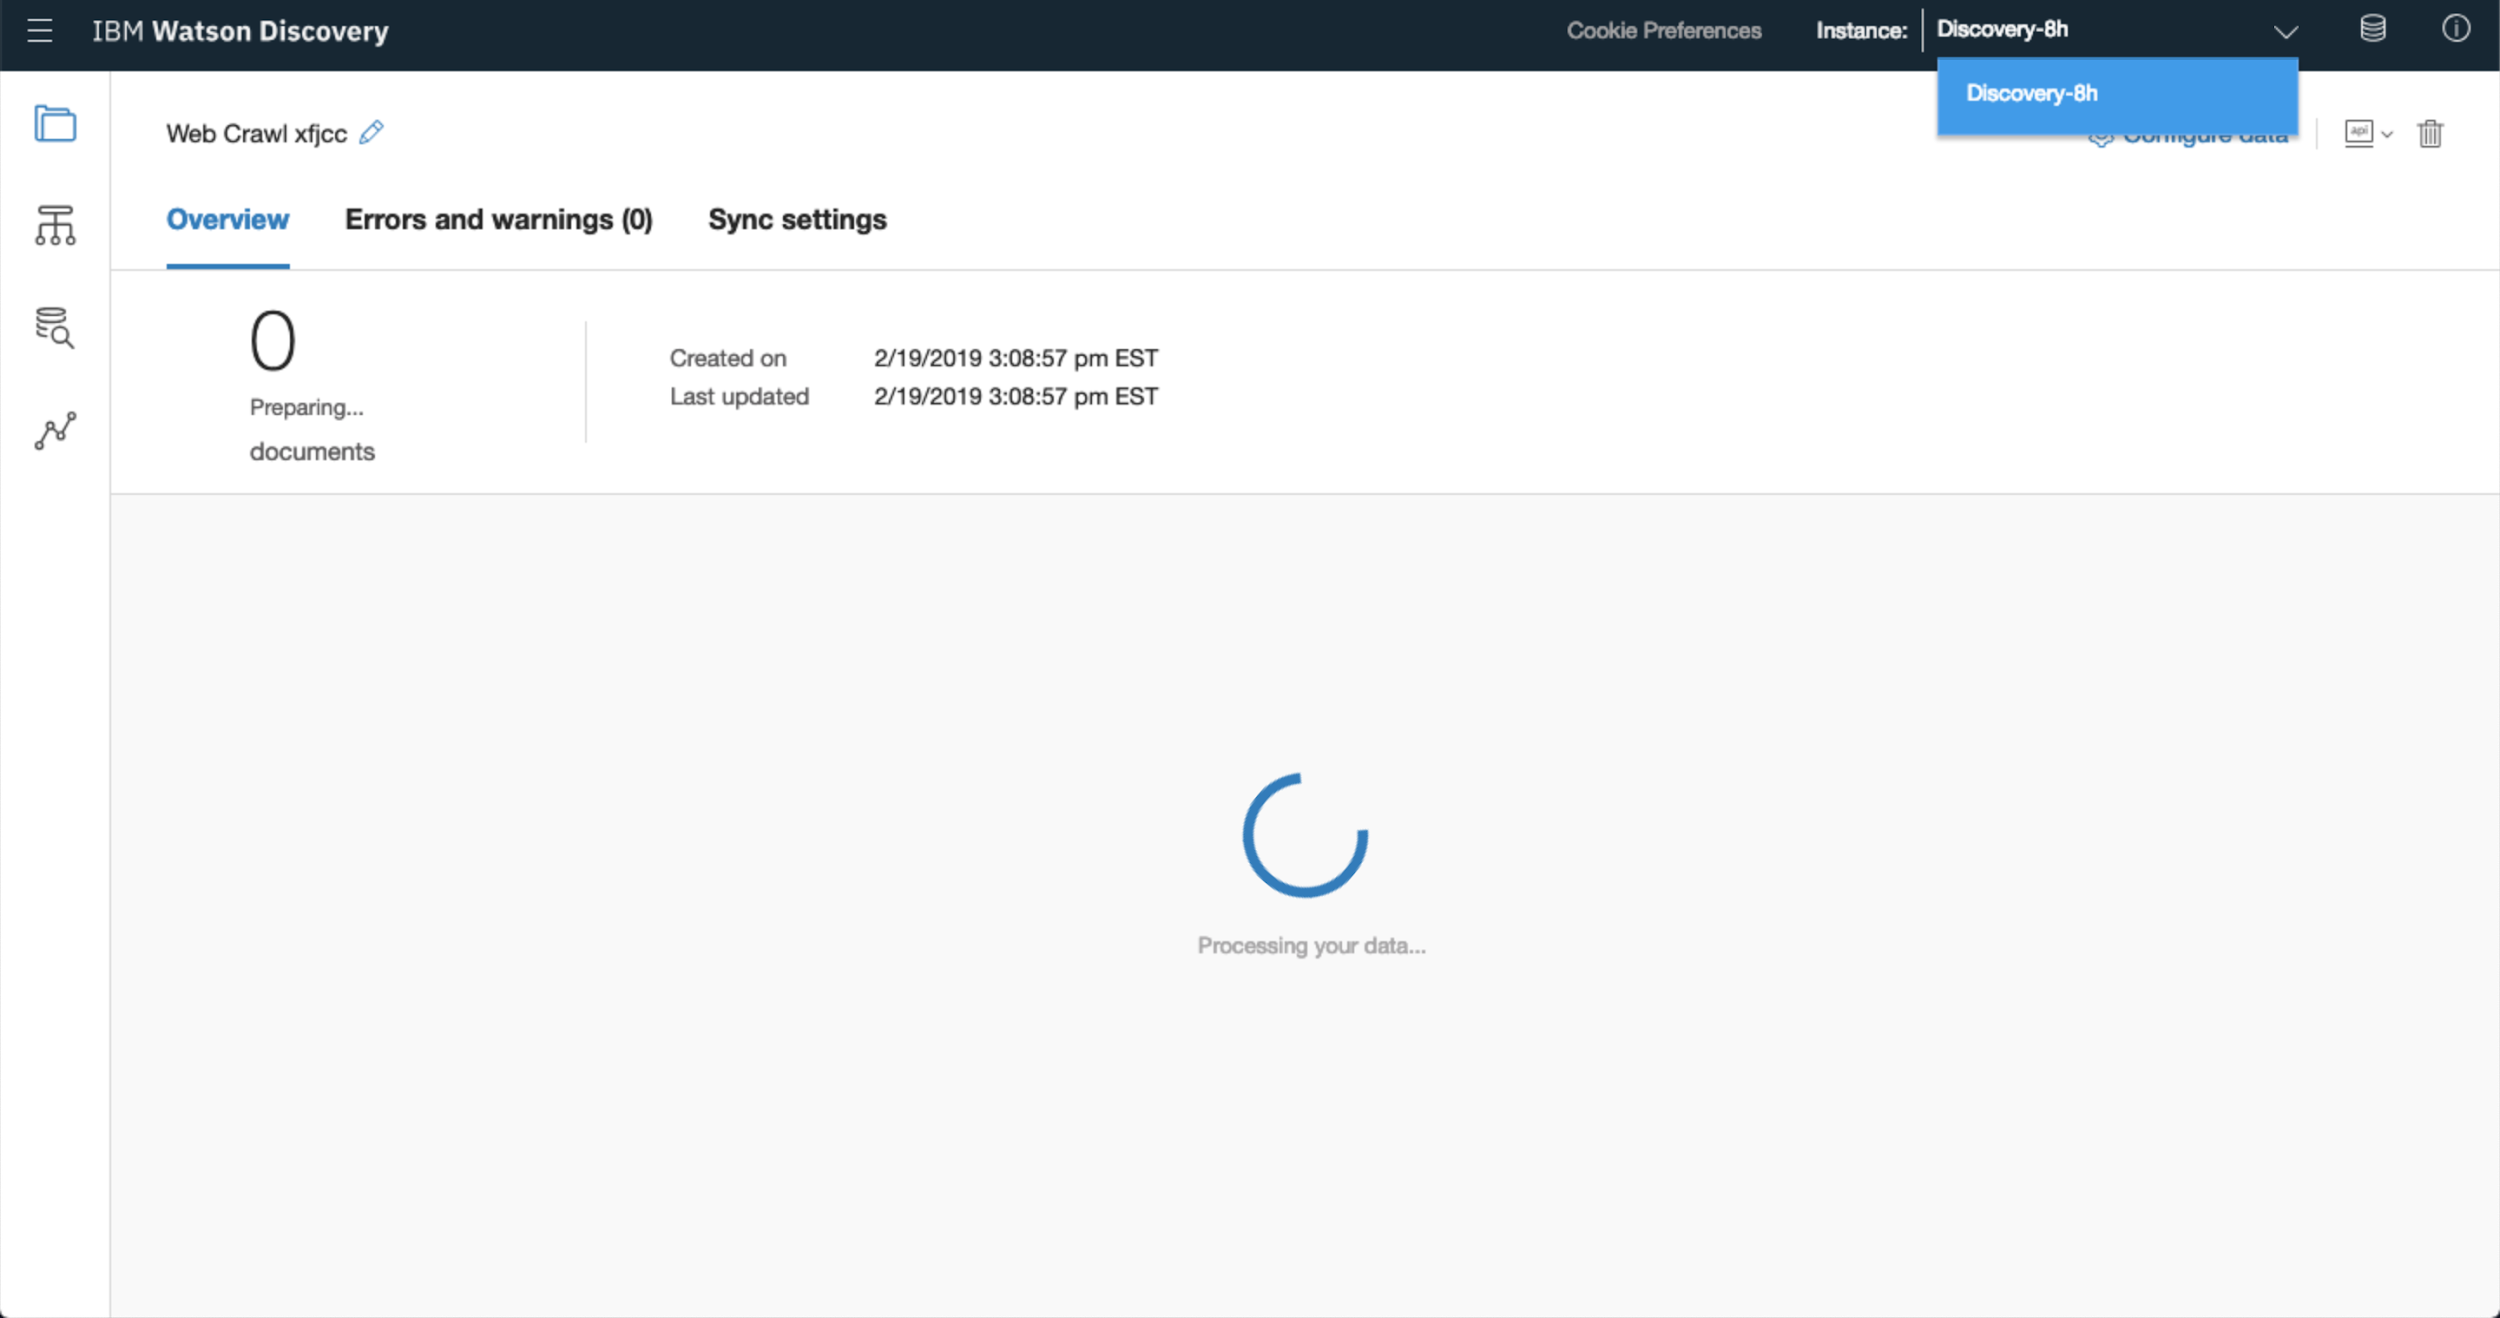
A new web crawl collection will be created and Watson will start scraping and categorising the data/documents found instantaneously. This might take a little while to complete, but once done, you can get started with making use of the documents crawled!
3. Viewing The Data Schema
The Data Schema view allows you to get an overall view of the data that the web crawler has collected.
You can view the schema by clicking the Schema icon on the left hand side of the home dashboard page.

This will take bring you to the schema’s collection view. From here you’re able to analyse the crawled documents based on the constructs that Watson Discovery has detected.
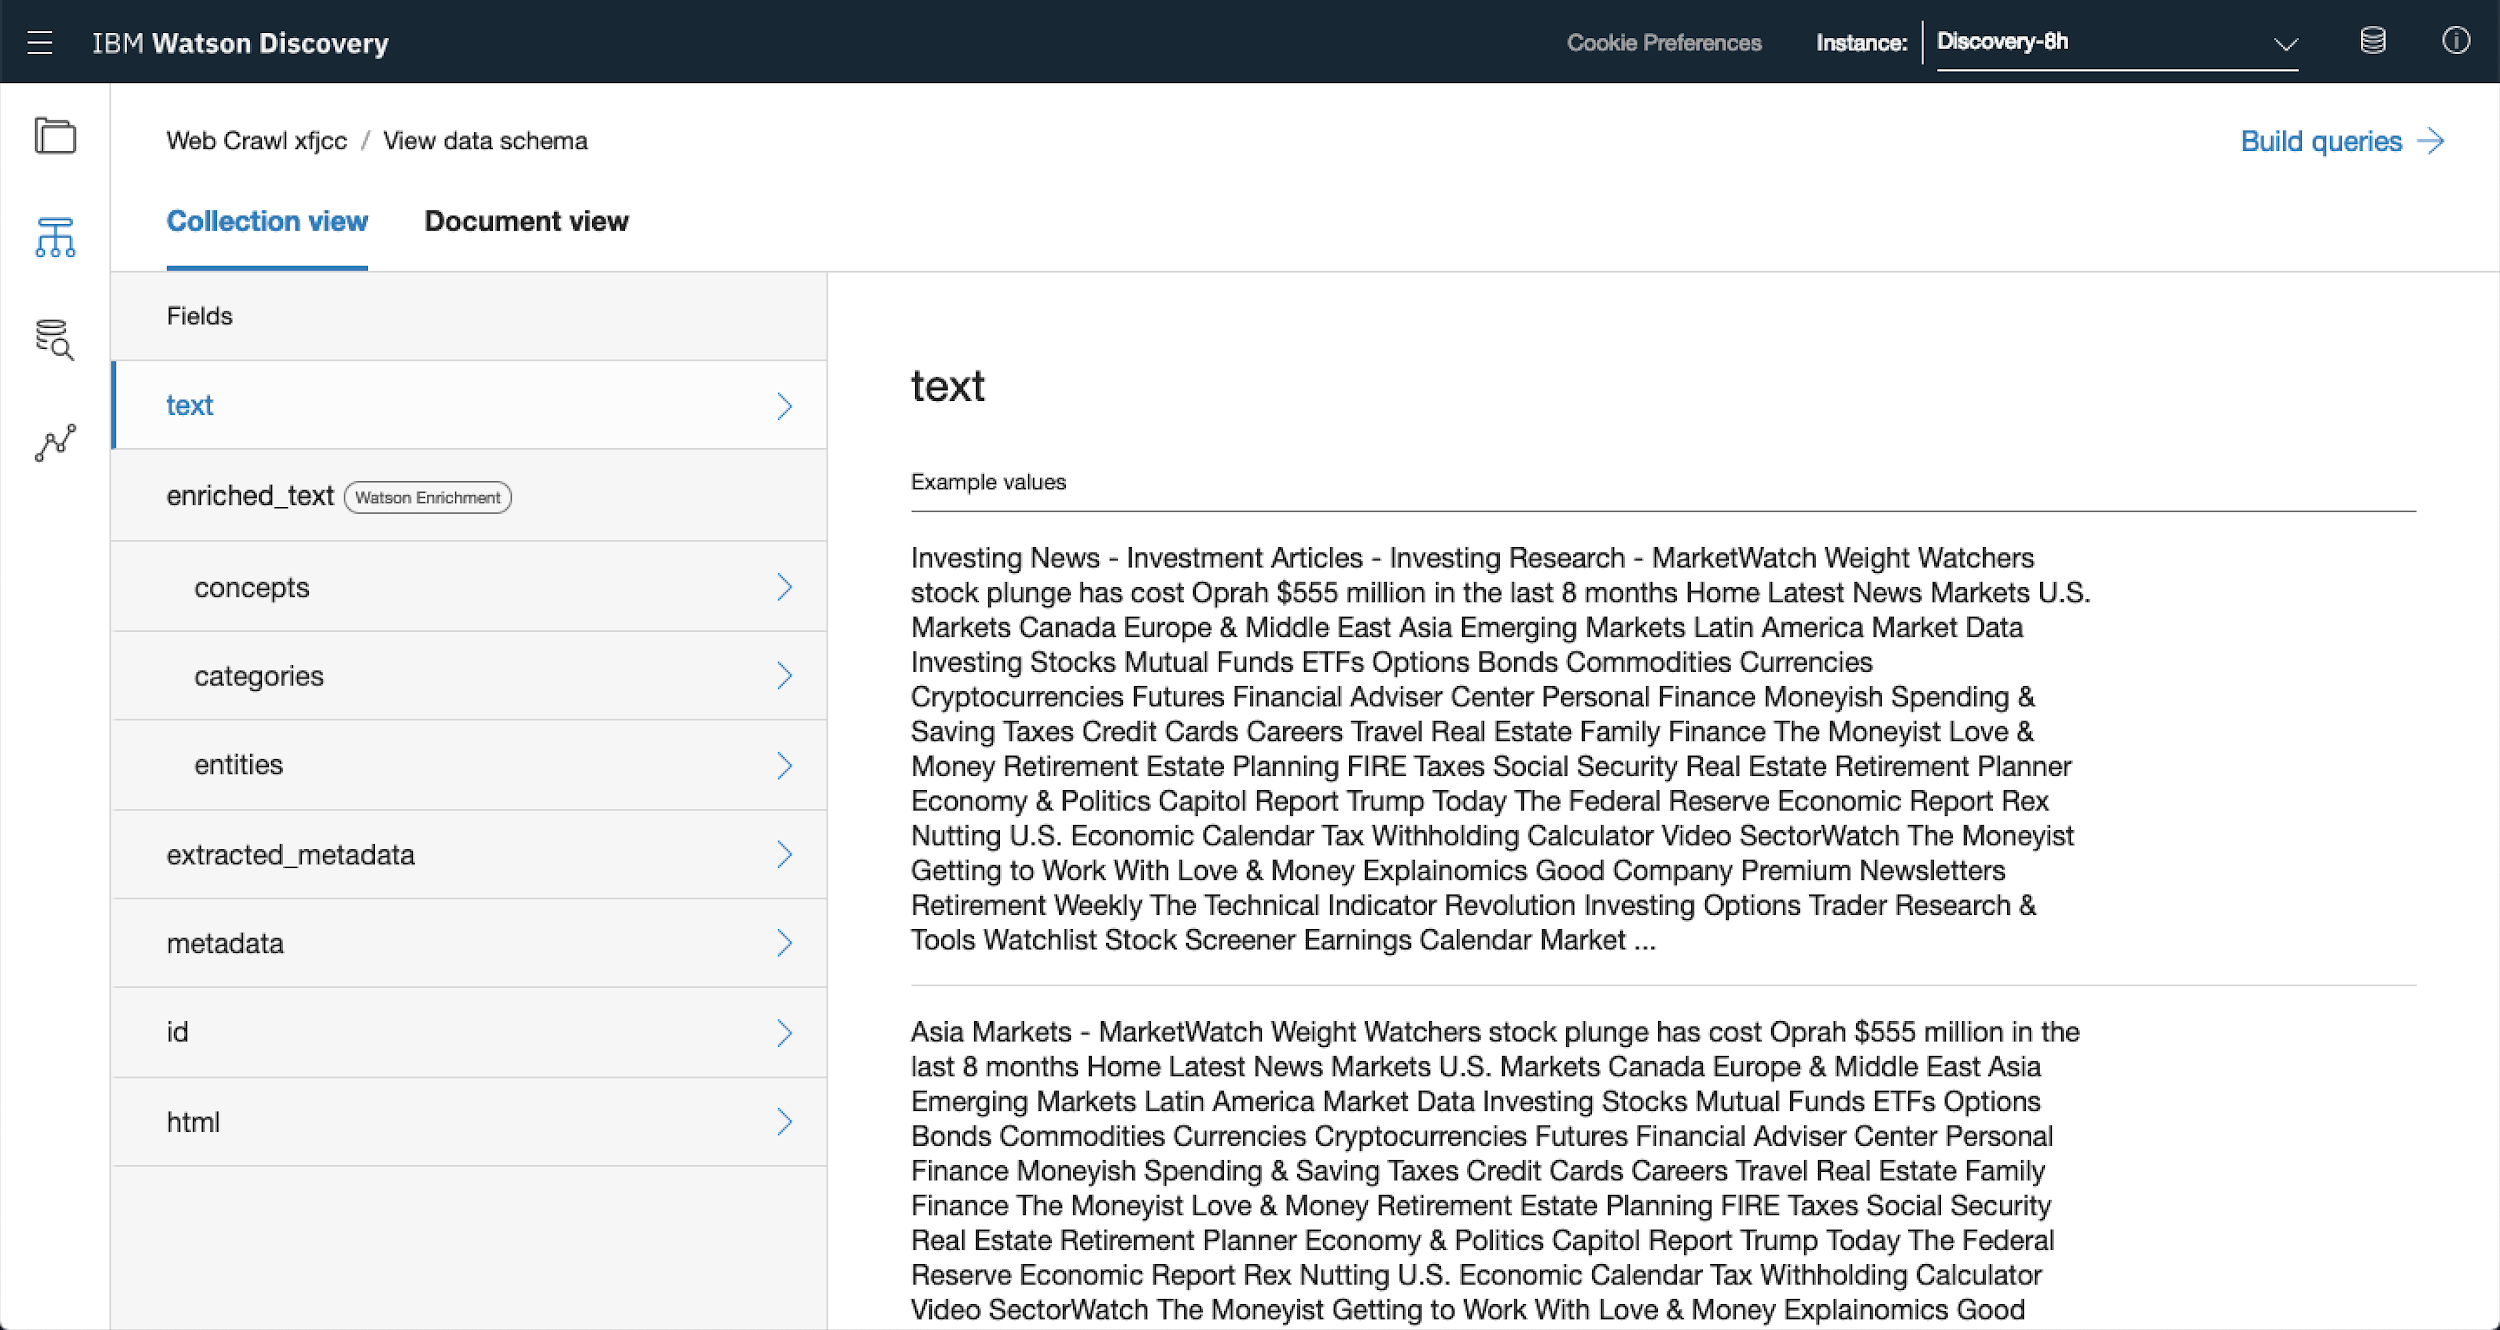
If you used the same links shown above, Watson will have identified a number of blocks of text.
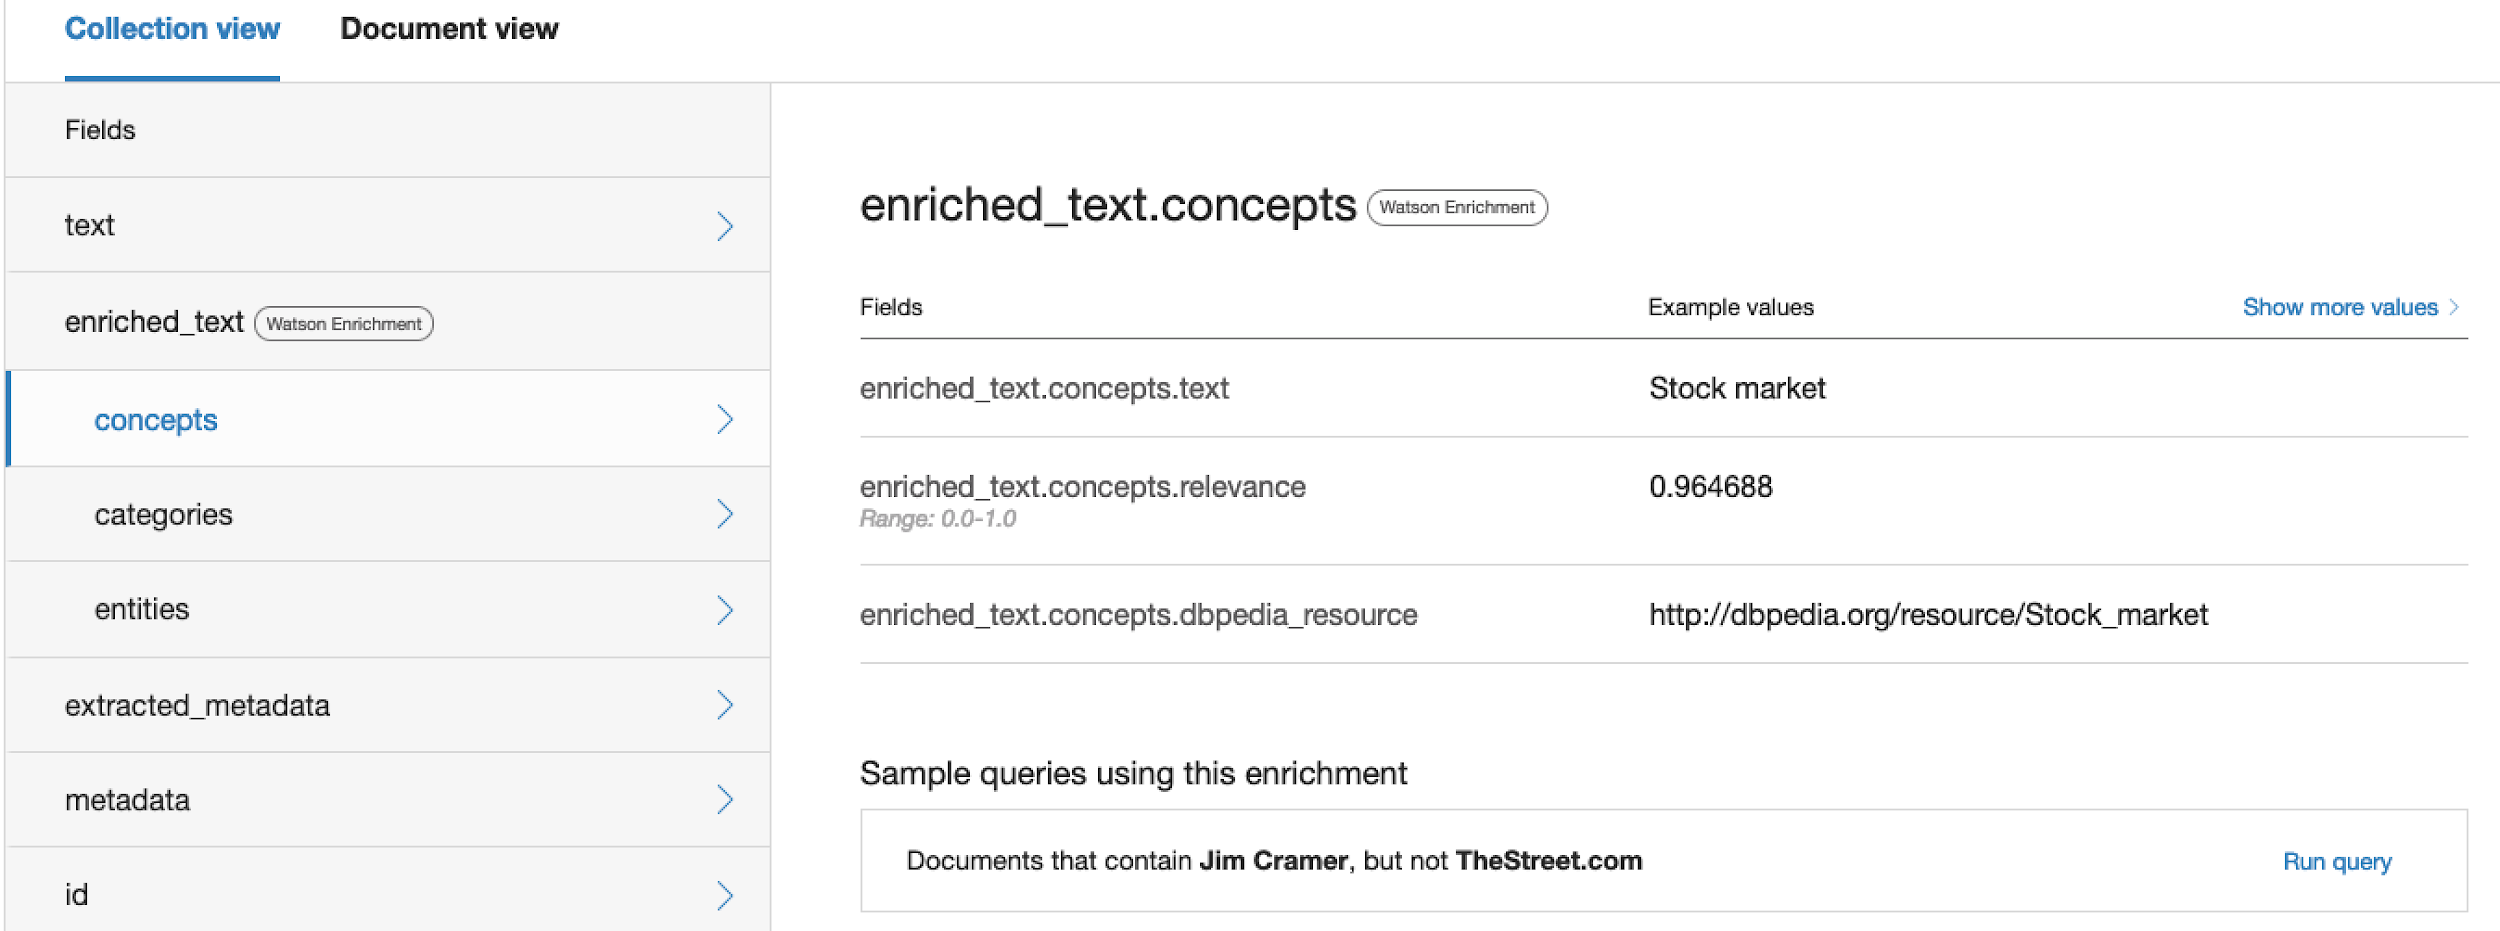
These will have been automatically enriched to highlight concepts, categories and entities. These are constructs that Watson Discovery uses to categorise different parts of the documents it has collected.
Here’s the lowdown on what each of them represents
| Concepts | Topics, constructs, theories or ideas that appear within the documents. These don’t need to be explicitly identified identified in the text in order for Watson to determine the concept however. For example, an article may mention Return on Equity and Inventory Turnover. Watson may determine that the concept being described as being financial ratios or KPIs. |
| Categories | Overall themes that are discussed in the documents. For example given the large majority of the documents collected revolve around Finance, categories may include Finance but also delve deeper and classify documents as focused on equities, ETFs and derivatives. |
| Entities | Refer to people, places or things aka nouns. In the documents the most common entities would be the companies being discussed, key leadership figures and locations. |
You can interrogate each of these features from the collection view by clicking on each arrow. To see more examples of that particular feature just select Show more values.
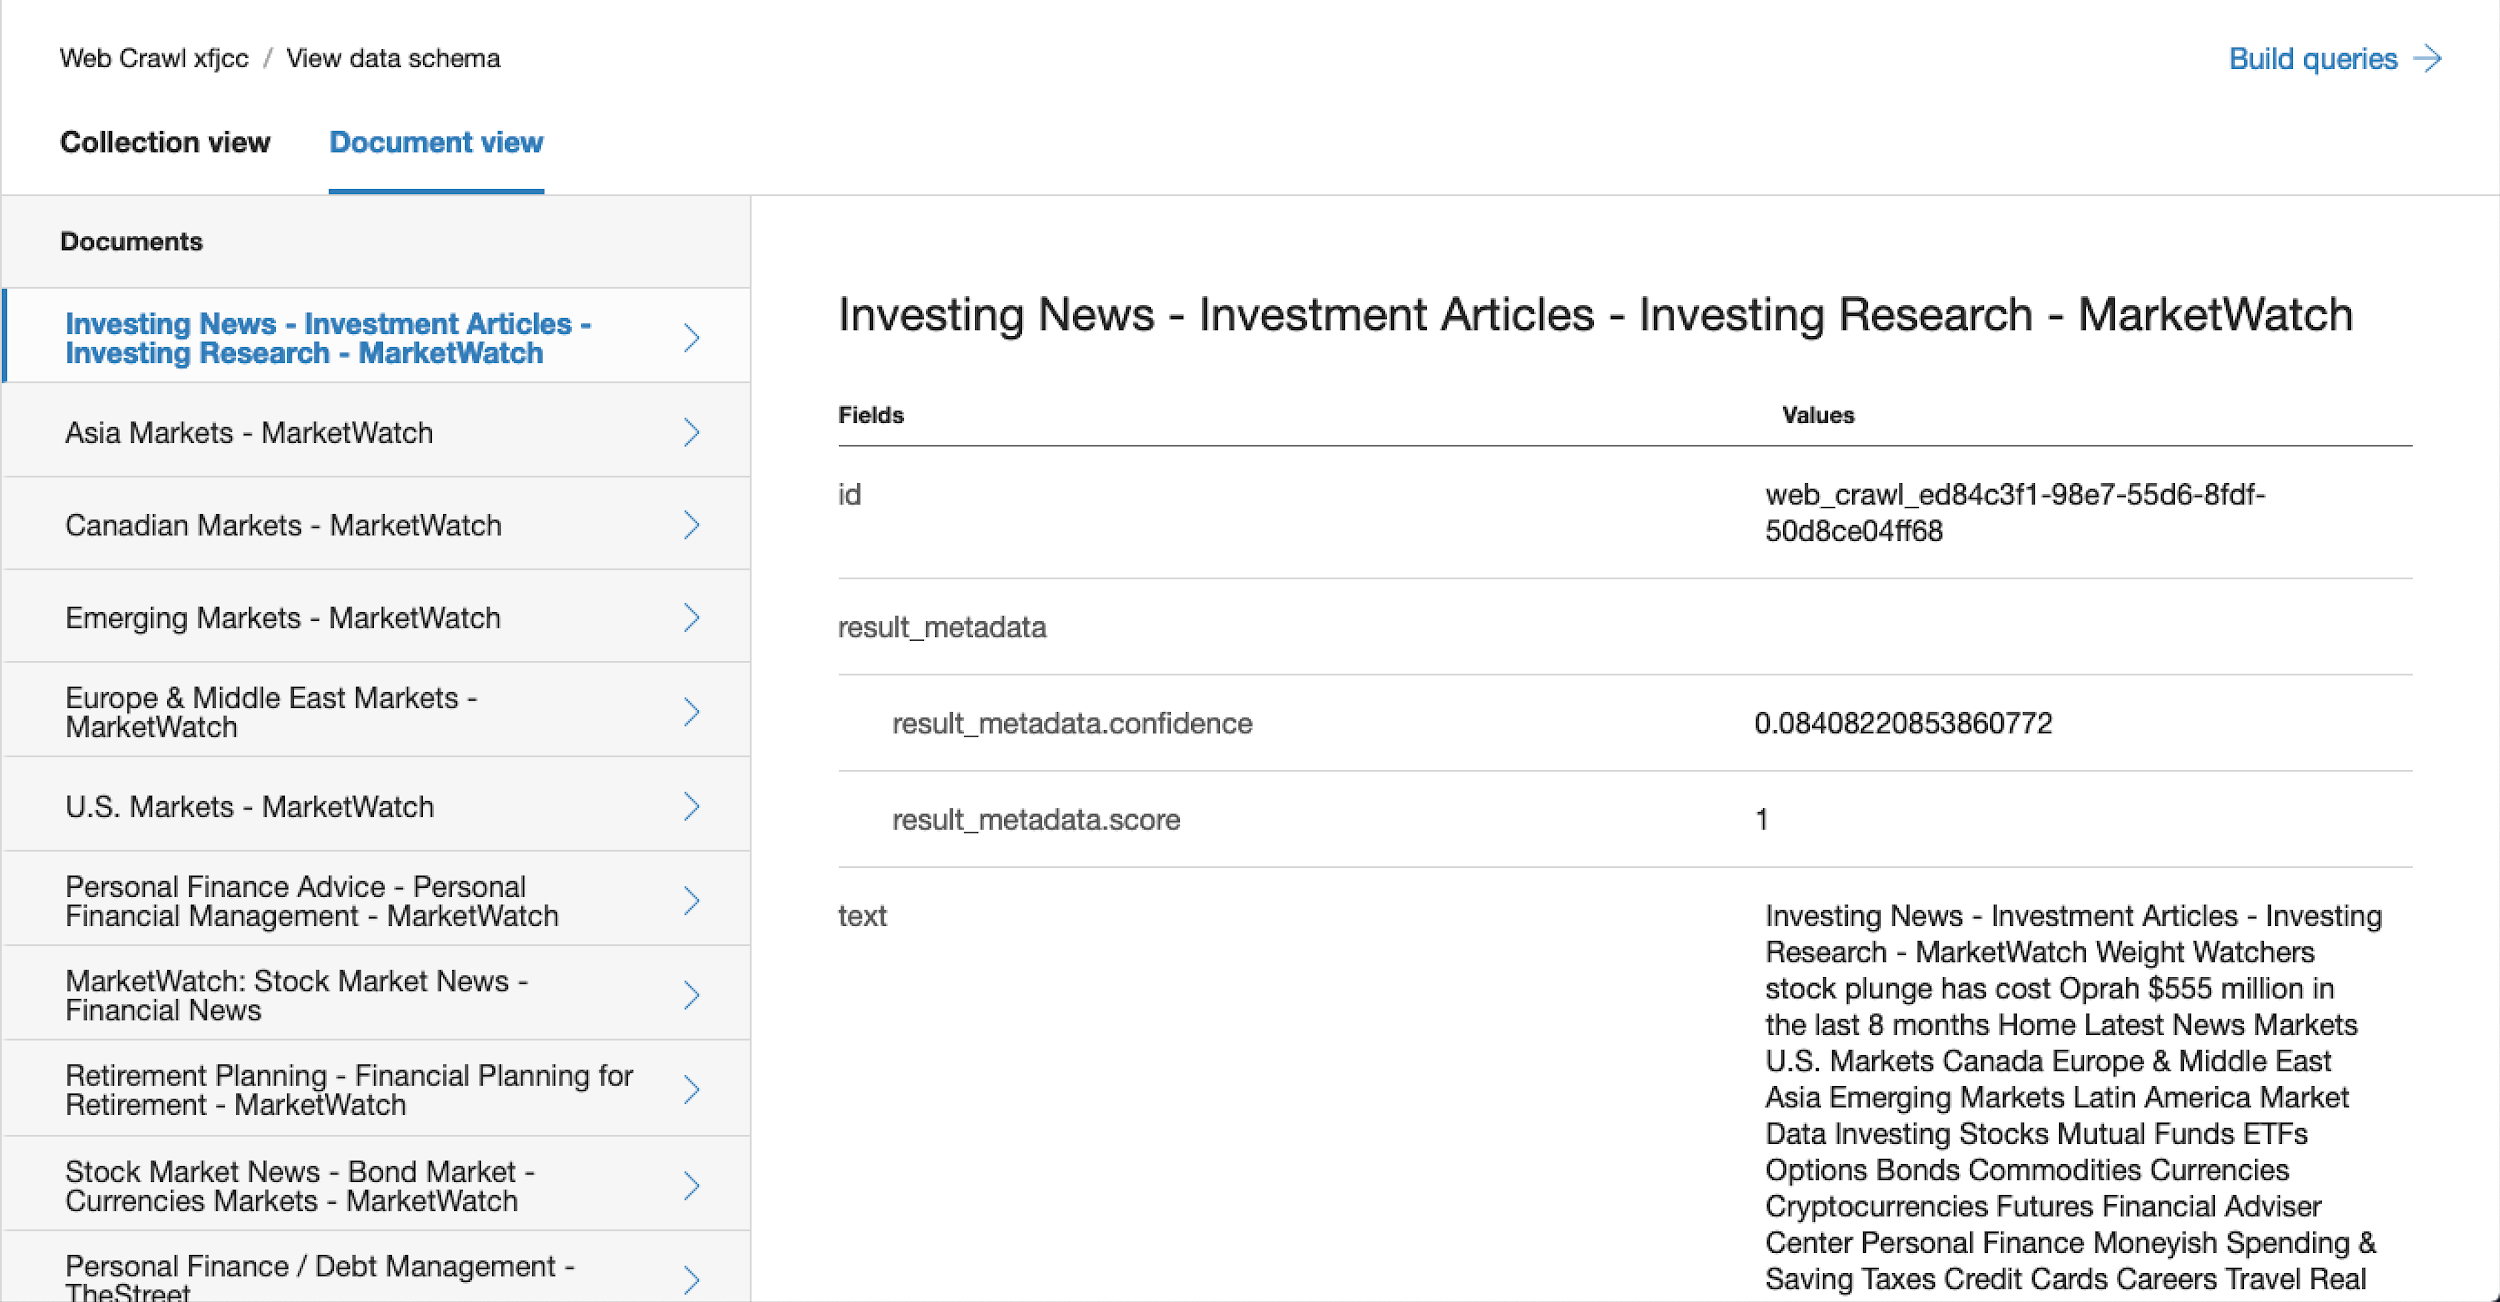
If you prefer you can also review the collected information by Document by selecting Document view. From here you can see all the same entities that you would in collection view but now they’re grouped by document.
4. Running Queries
Once you’re done searching through the document schema you can analysing some of the data that’s been collected. All of the schema entries which we went through in Step 3 are able to be queried from Watson Discovery.
To get started with queries from the dashboard page select the collection you want to analyse. In this case, select the web crawl collection that you created in Step 2.
As soon as you select the collection you’ll be taken to a dashboard for that query.
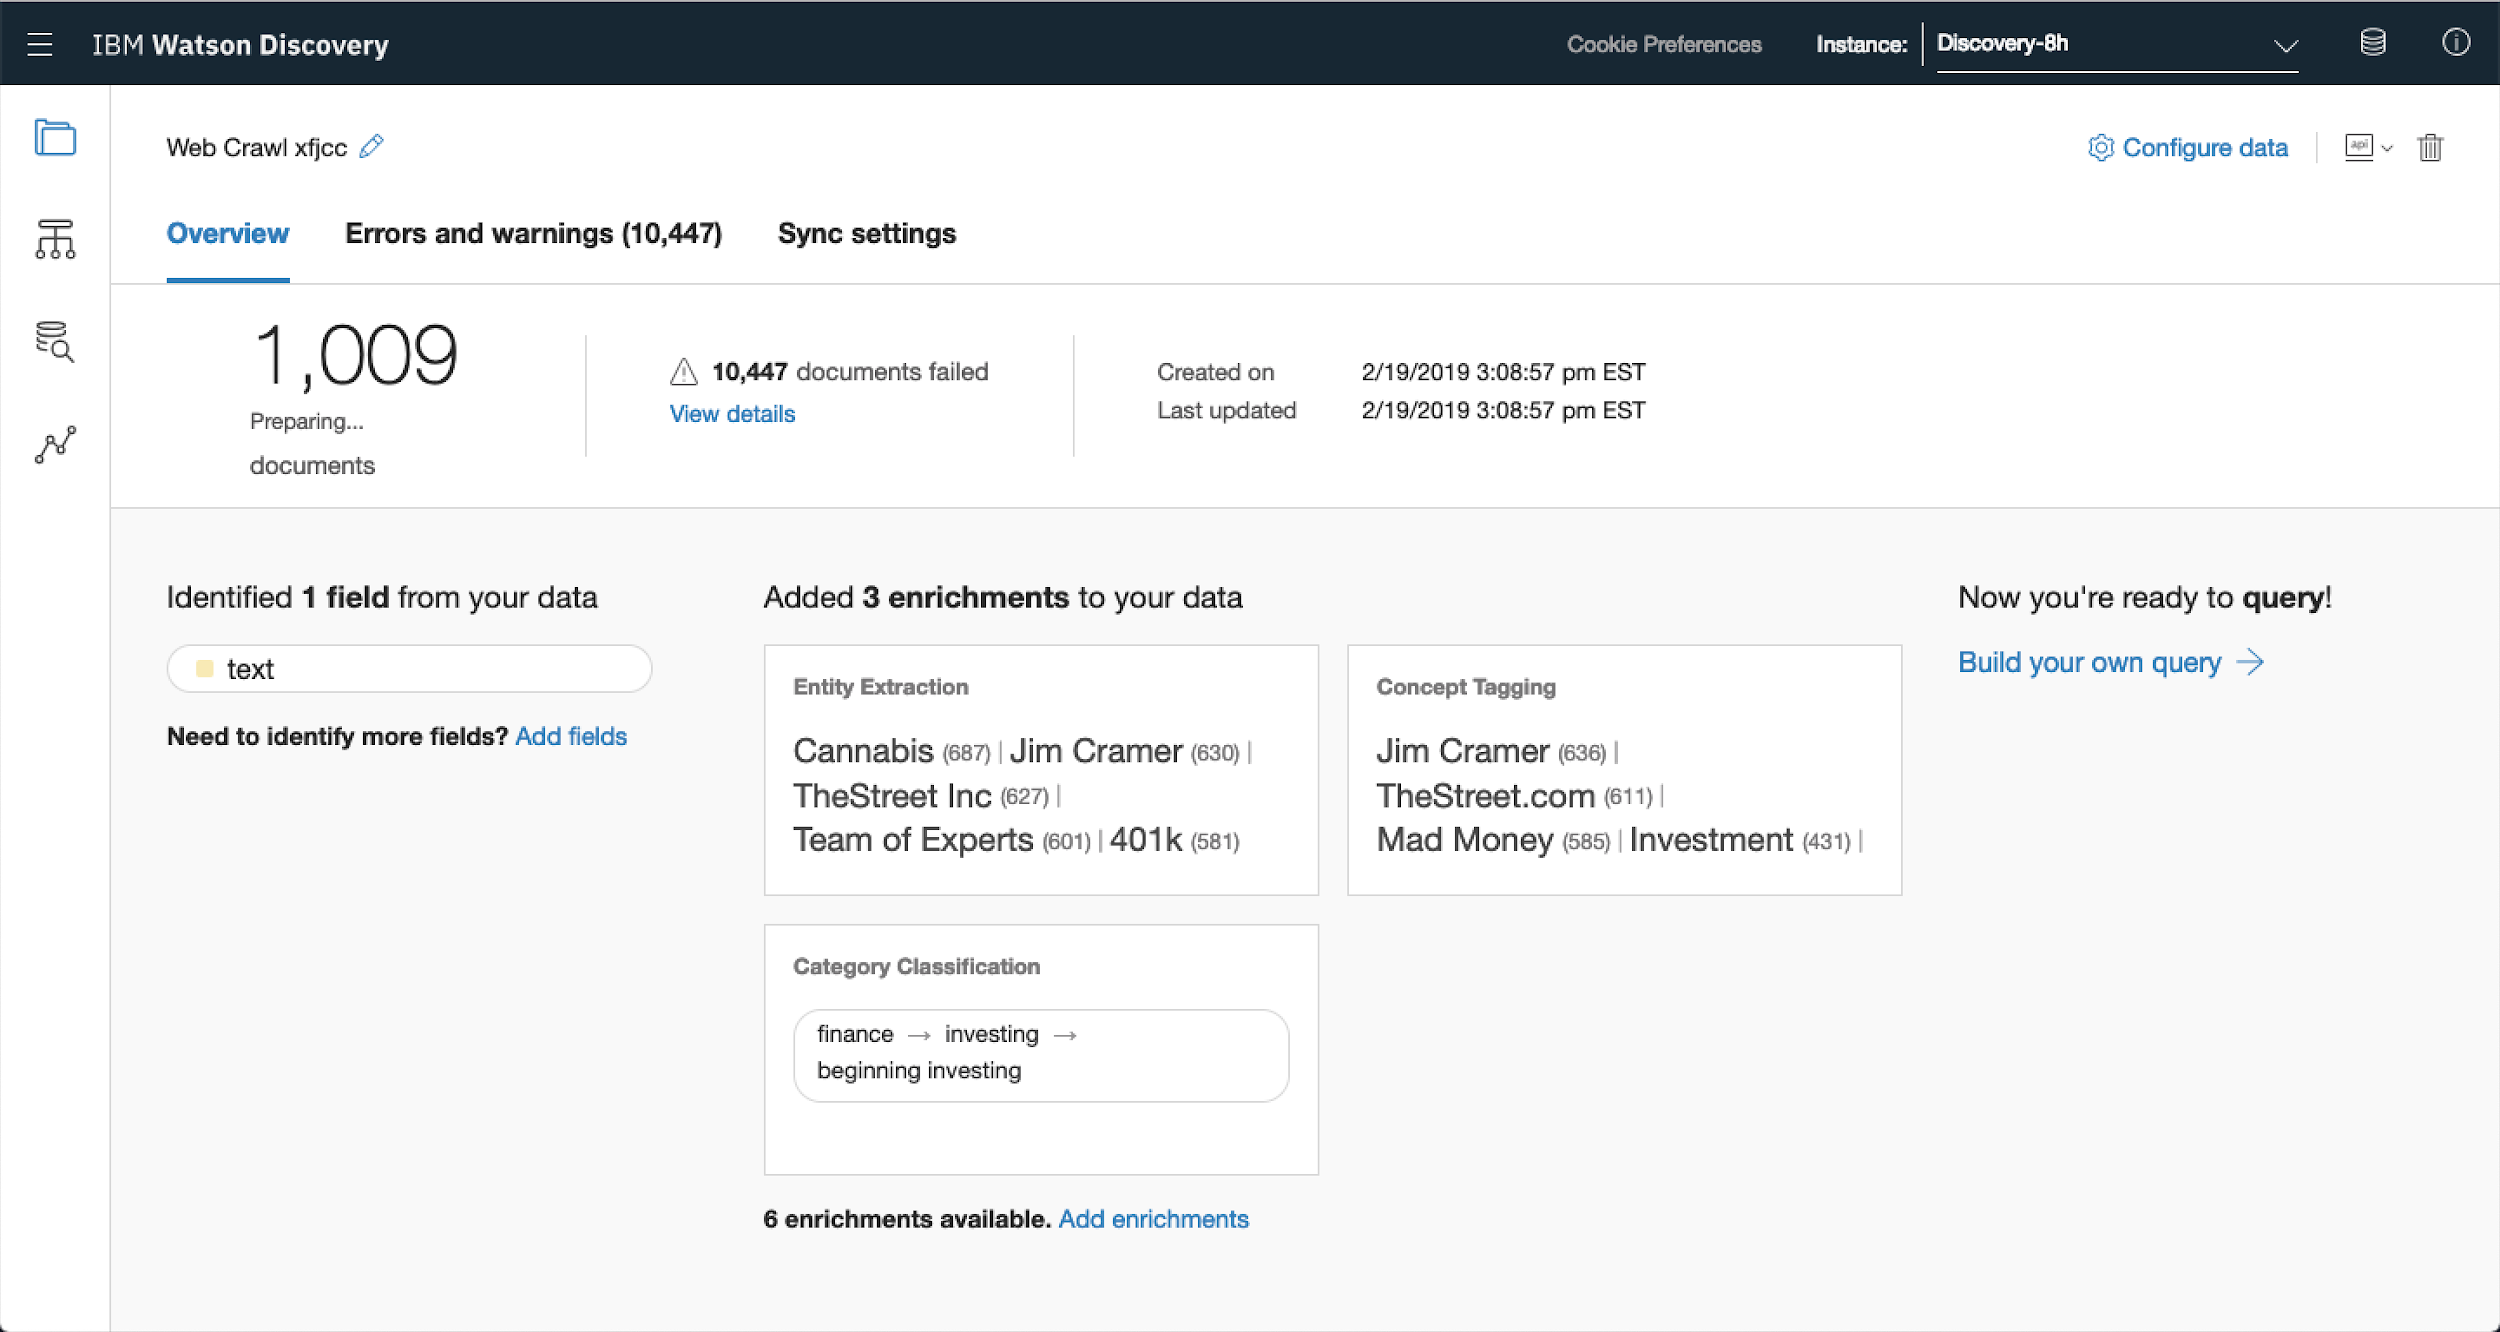
From here you’re able to get an overview of the crawl, the dashboard highlights:
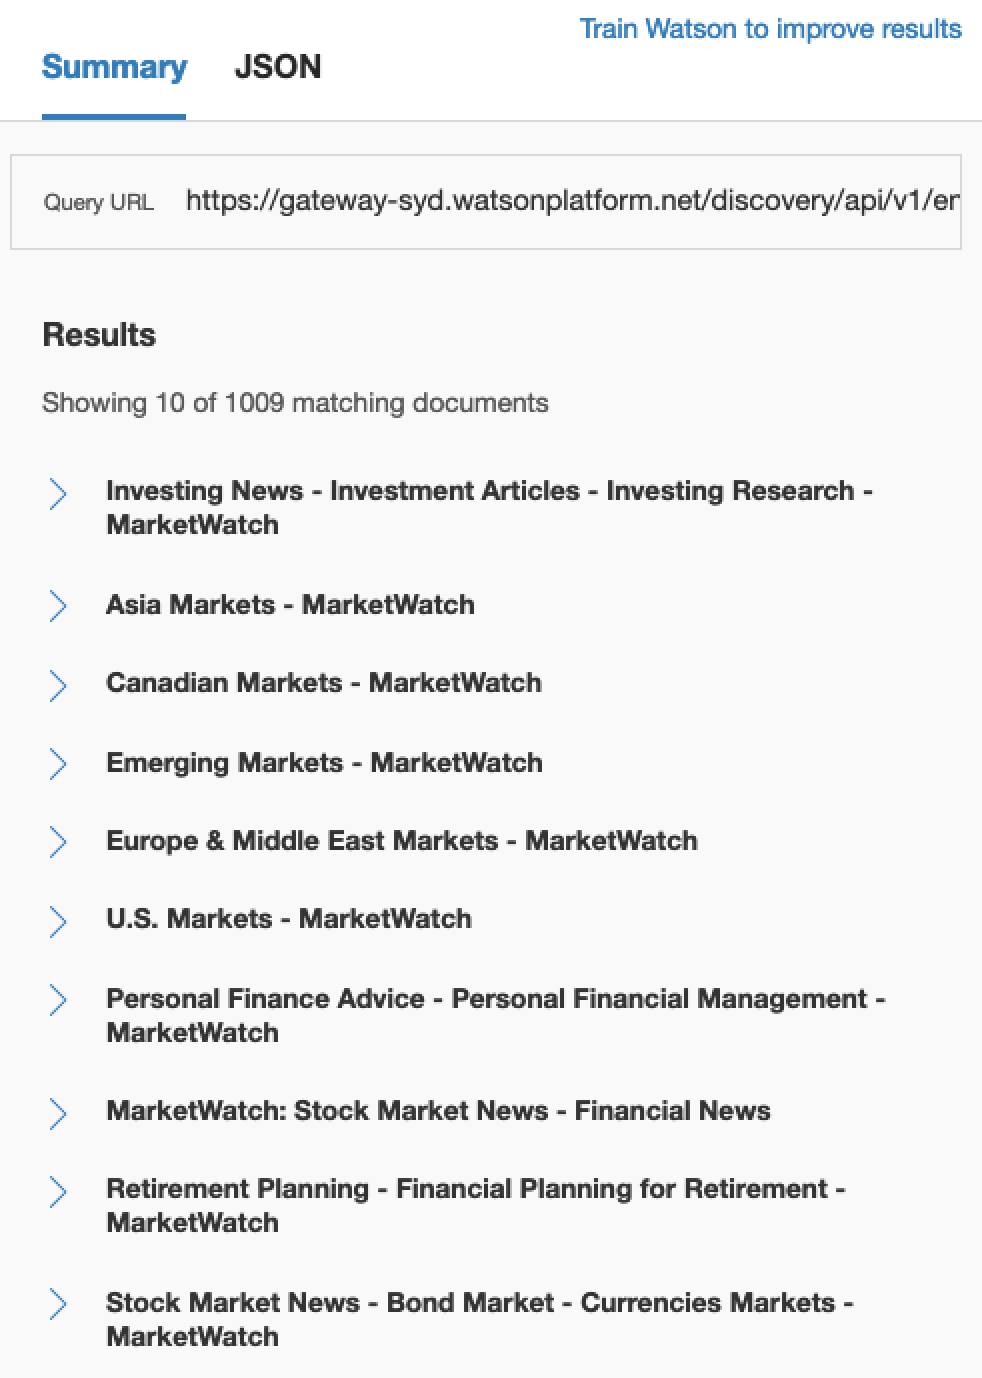
- Number of documents collected (1,009)
- Top entities, concepts and categories found (shown under enrichments)
From that dashboard you’re also able to quickly see any errors that might have occurred during the collection phase. Let’s ignore these for now and delve into the querying.
As soon as Watson Discovery has finished preparing the documents you’ll be able to start running queries against them. On the home page you’ll have three queries that are already available to you.
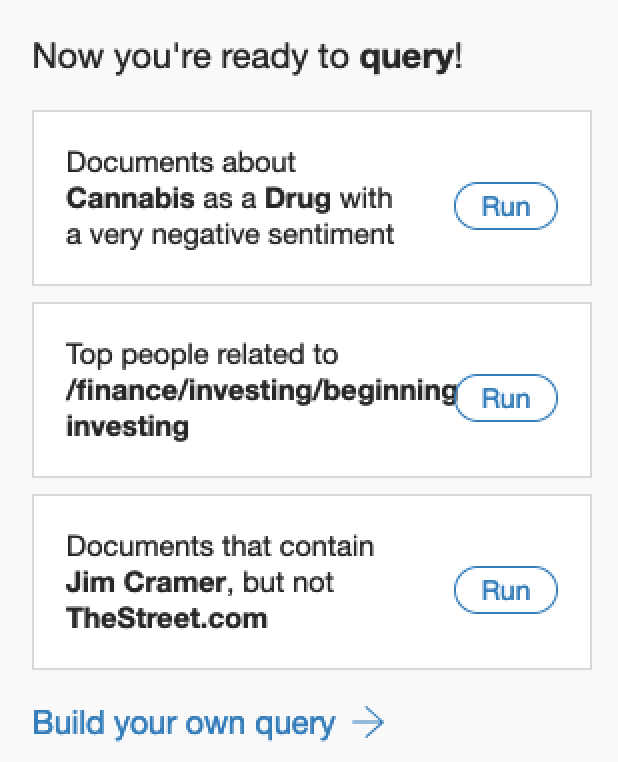
Select the second query. You’ll be taken to the query builder page and the results will be displayed on the right hand side.
If you selected Top People Related to Finance what should be returned is a key list of people (from the documented entities) filtered by number of mentioned within the text.
Here you’re able to see Mad Money’s Jim Cramer ranking top. Given one of the URLs that was crawled was The Street, a platform that he writes on frequently, this is not entirely unexpected.
You can however get a lot more sophisticated with your queries. There are three different ways to do that.
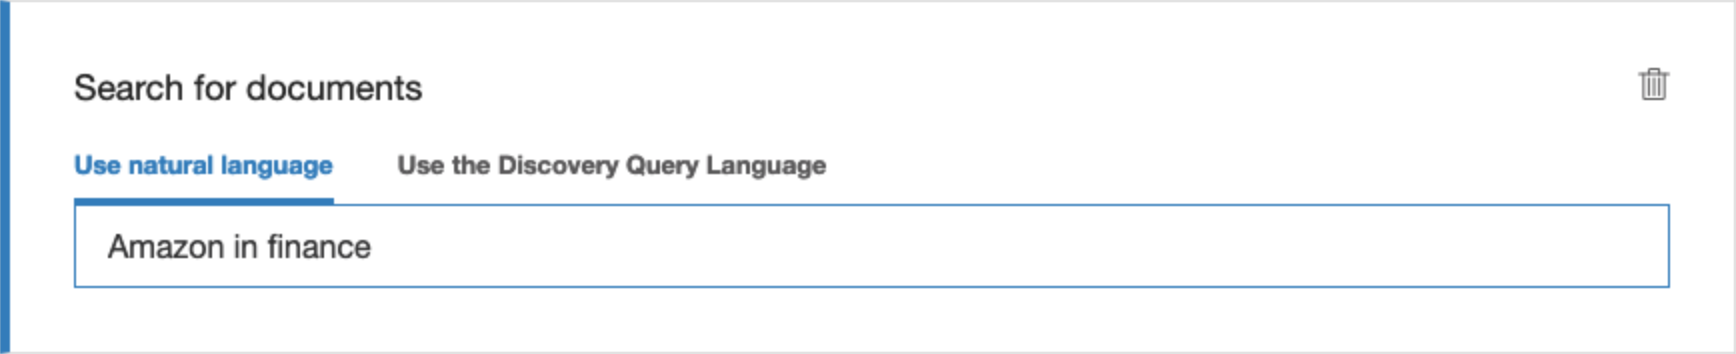
First up, Watson’s natural language query processor. This allows you to write queries in plain text, say for example you wanted to bring up search results for Amazon (an entity) that were to do with finance (a category), you could write something like this.
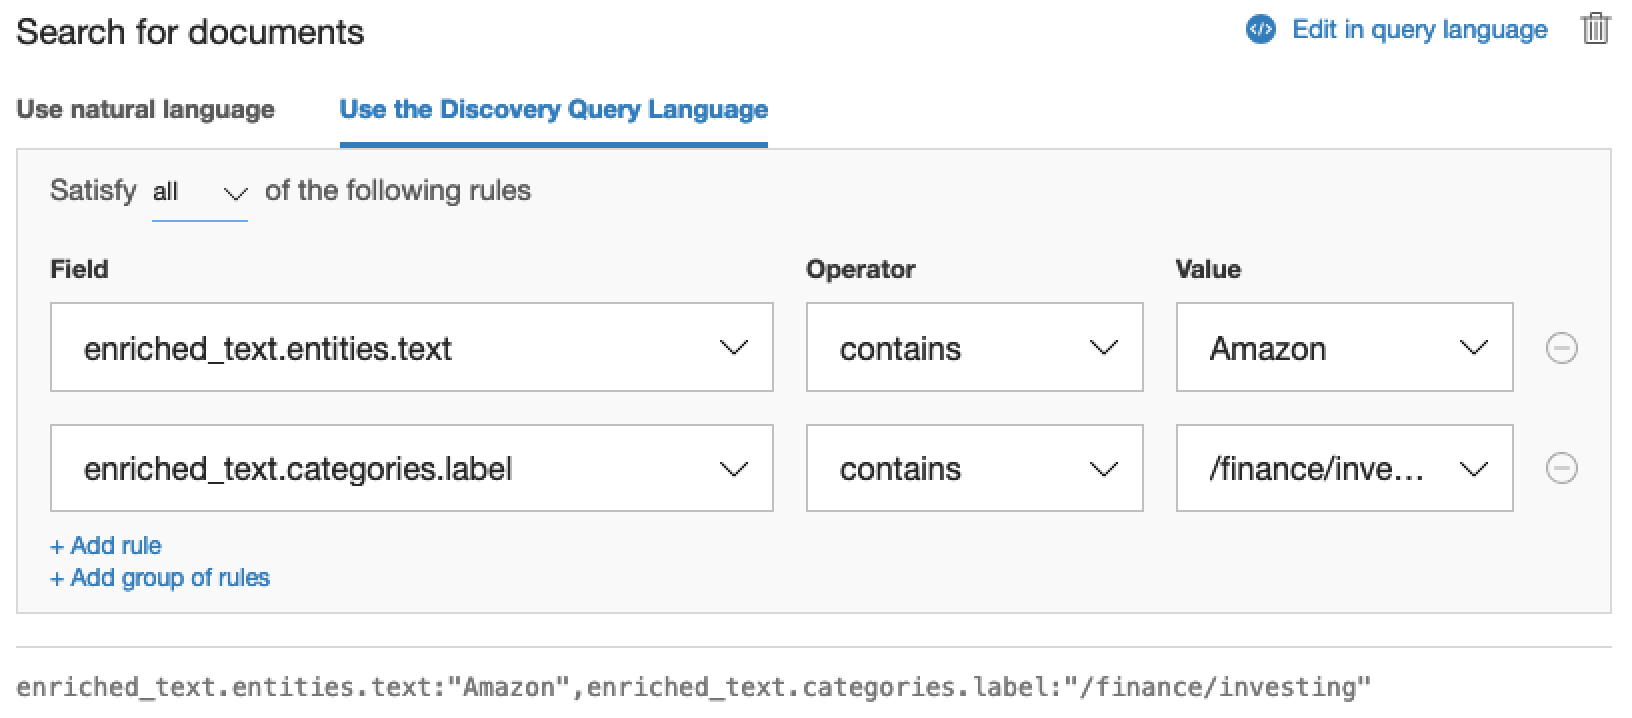
Or you can use the query builder to achieve the same thing. The fields work like WHERE statement in that they allow you to filter through documents using the fields defined as part of the document schema.
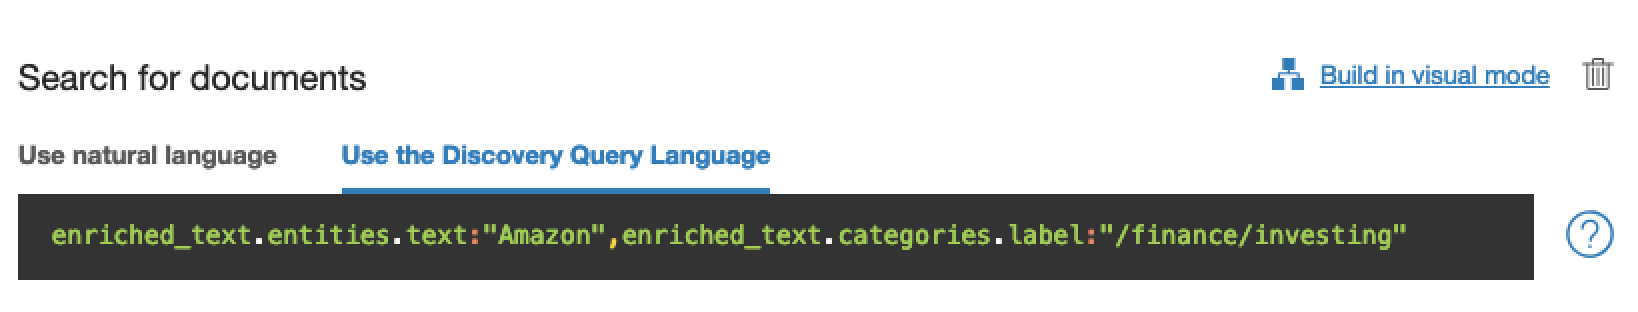
Finally, you can also use Watson’s query language to search through the documents. This is a proprietary language specific to Watson Discovery. Take a look at the image above. The text right at the bottom in grey is actually an example query written in the query language.
You can quickly switch over to using the query language by clicking Edit in query language. Your query should now look something like this. (Note: it matches the grey text from above)
5. Building Better Queries
So far, you’ve built relatively basic queries. You can however add two additional layers to your queries. These include aggregations and filters.
Let’s start with the simpler of the two concepts, aggregations.
Aggregations allow you to create summary statistics based on the documents. This is great if you’re looking to find top categories, people or entities because you can very quickly slice and dice through the documents collected to find what you need.
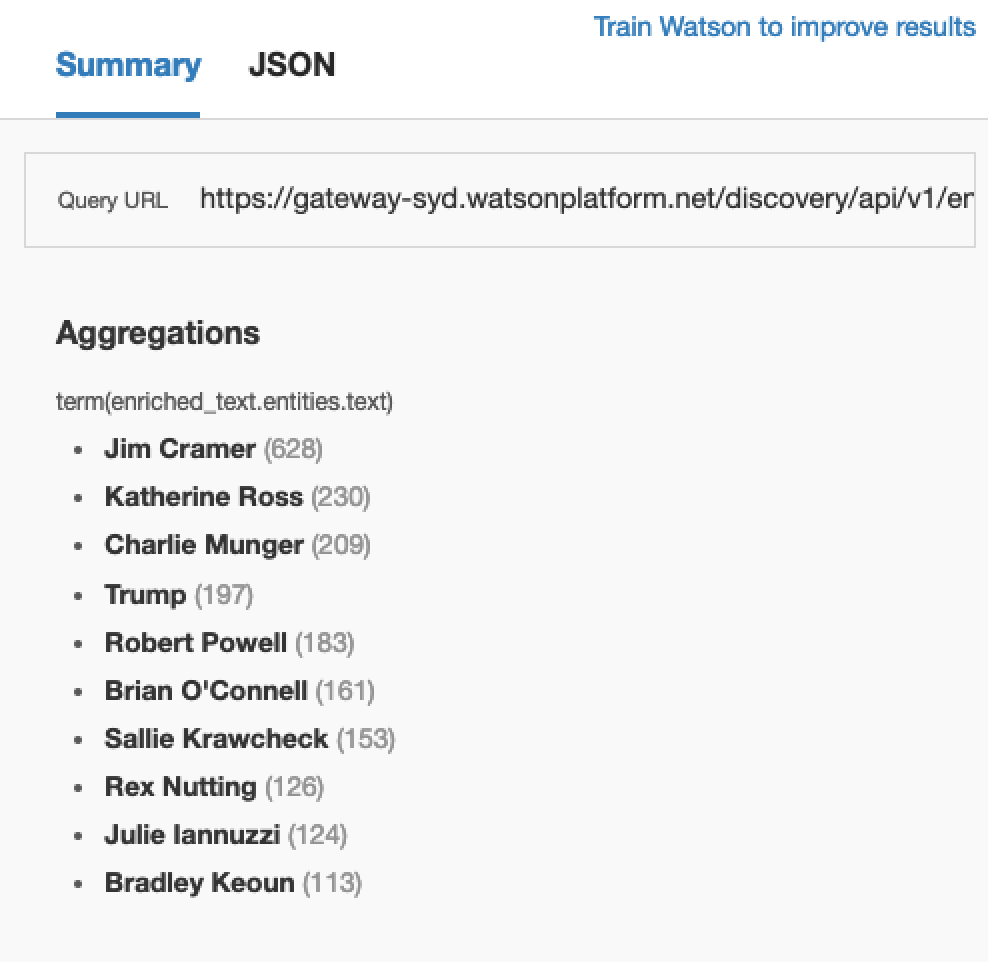
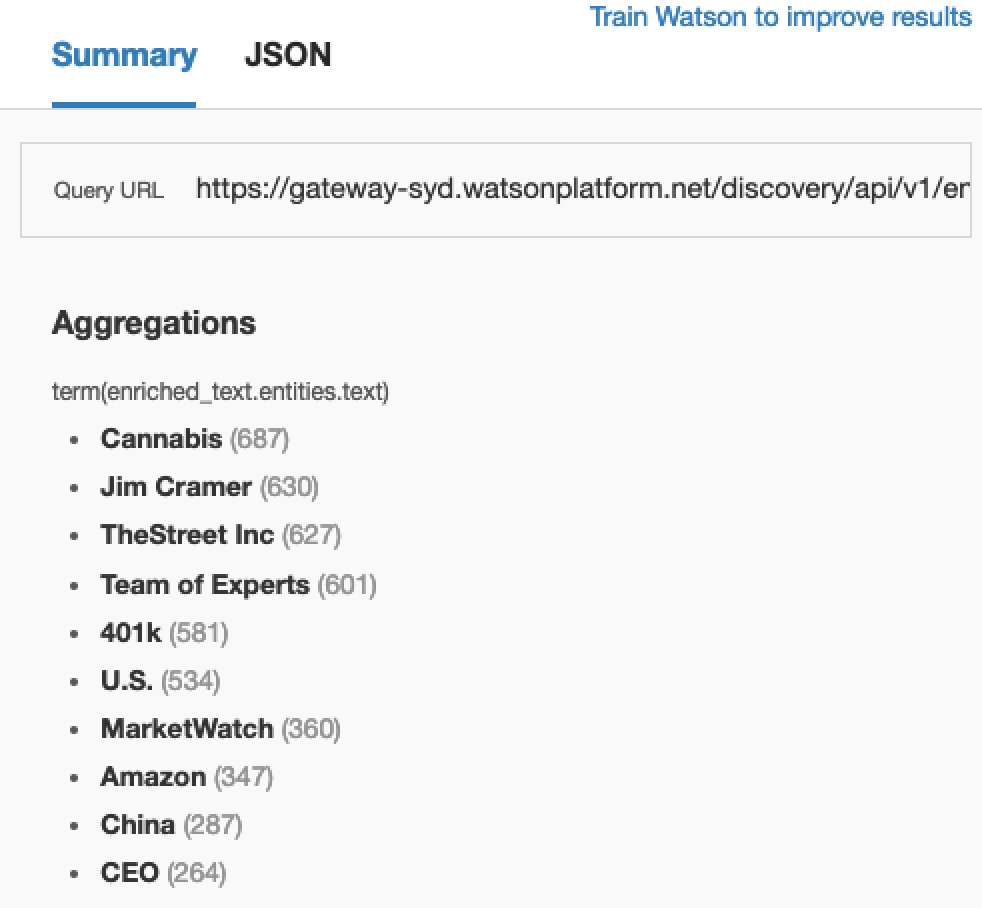
Say you wanted to take a look at the top entities that were consistently appearing throughout the documents. You could create an aggregation by entity.
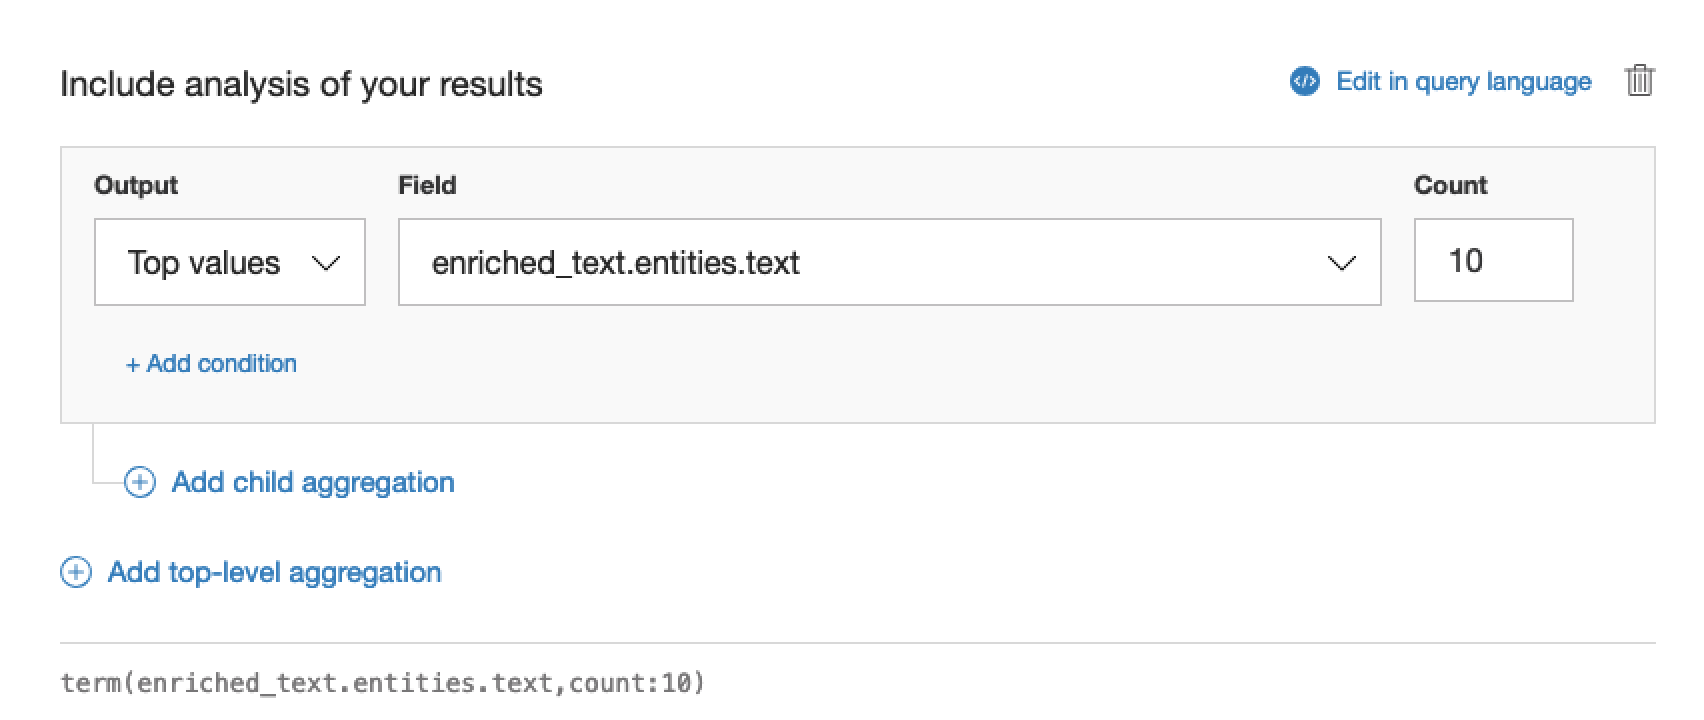
Which would yield results similar to this.
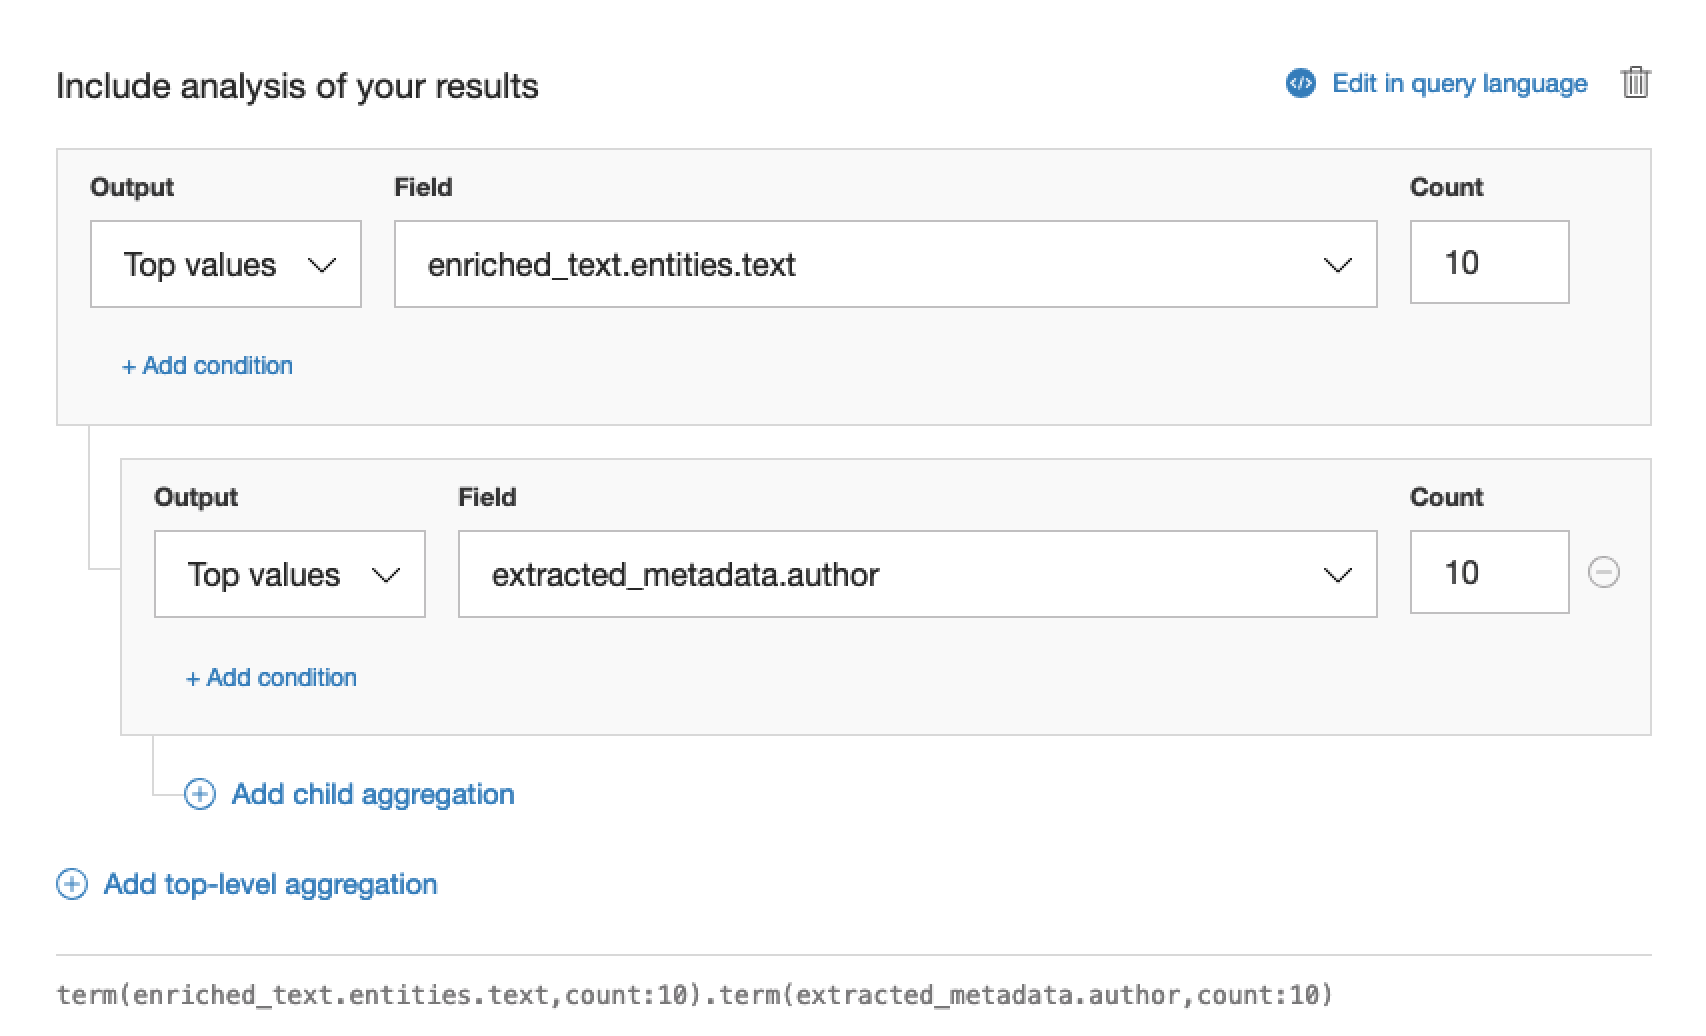
You then also add in an additional layer to your aggregation if you wanted the top authors in those categories like so.
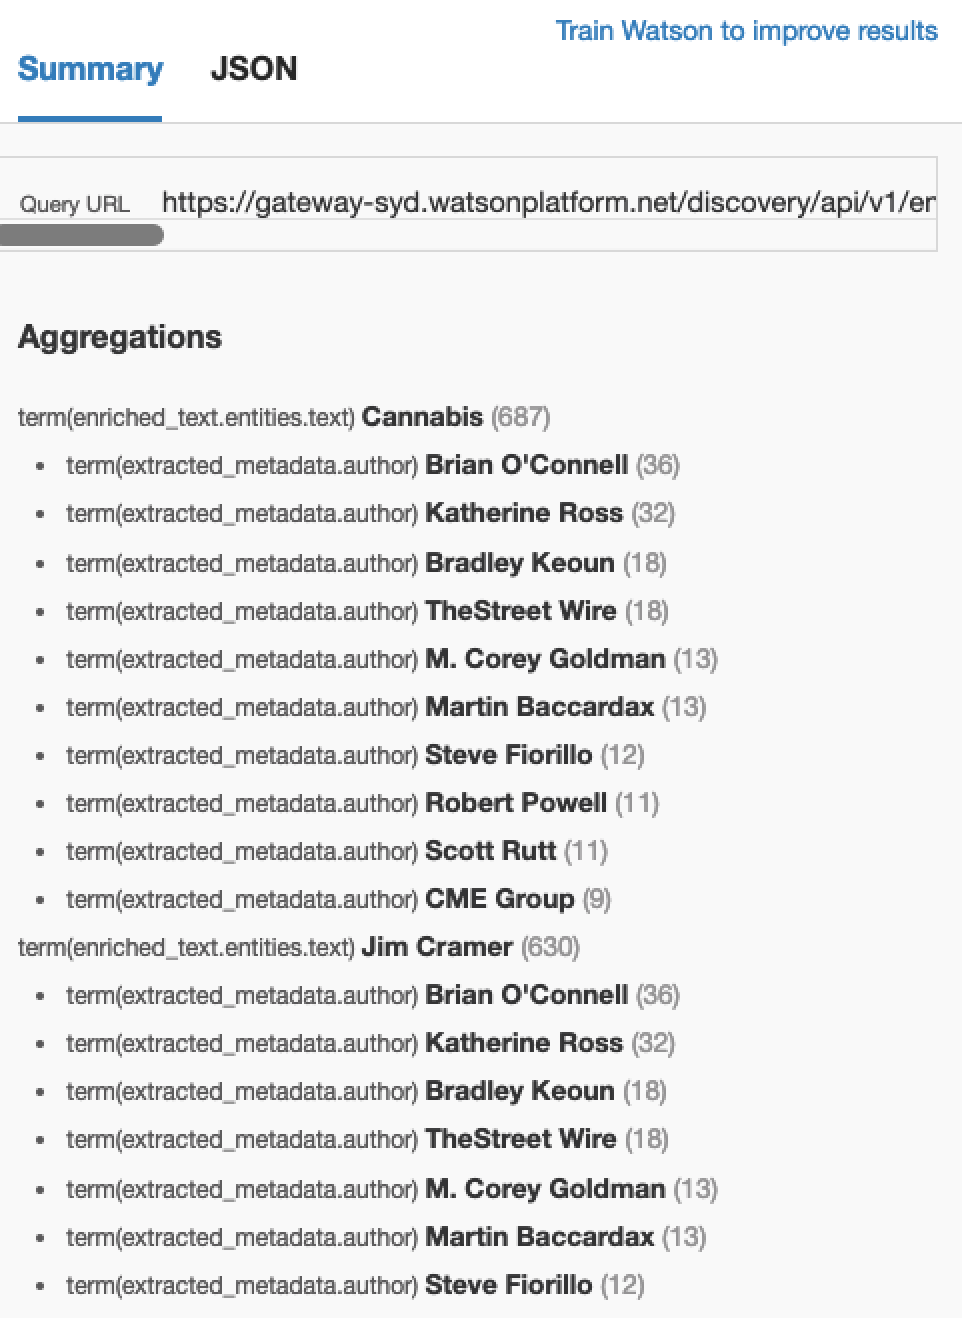
Which would change your result to something like this. You can see now that you’ve got a stacked aggregation with the top level categories displayed first followed by the top authors within those categories.
The other query parameter that you can use is the filter parameter.
You’re probably asking yourself now
“But I can already filter using the query? What the hell’s the filter for?”
You’re not wrong. There is however one key difference.
Performance.
The filter function filters through your documents without regard to ranking the search results. This means that it performs significantly faster over larger data sets versus using querying alone.
When you use filter together with aggregations and queries, the filter runs first and limits your search results then the aggregations and ranking filters (aka queries) are run in parallel. Check out this little spiel from IBM to find out more on the differences.
That being said using the filter is almost identical to how you would setup a query. You can build up your query using the visual mode or query language.
To apply a filter, click filter which documents you query.
Then build up your query as usual.
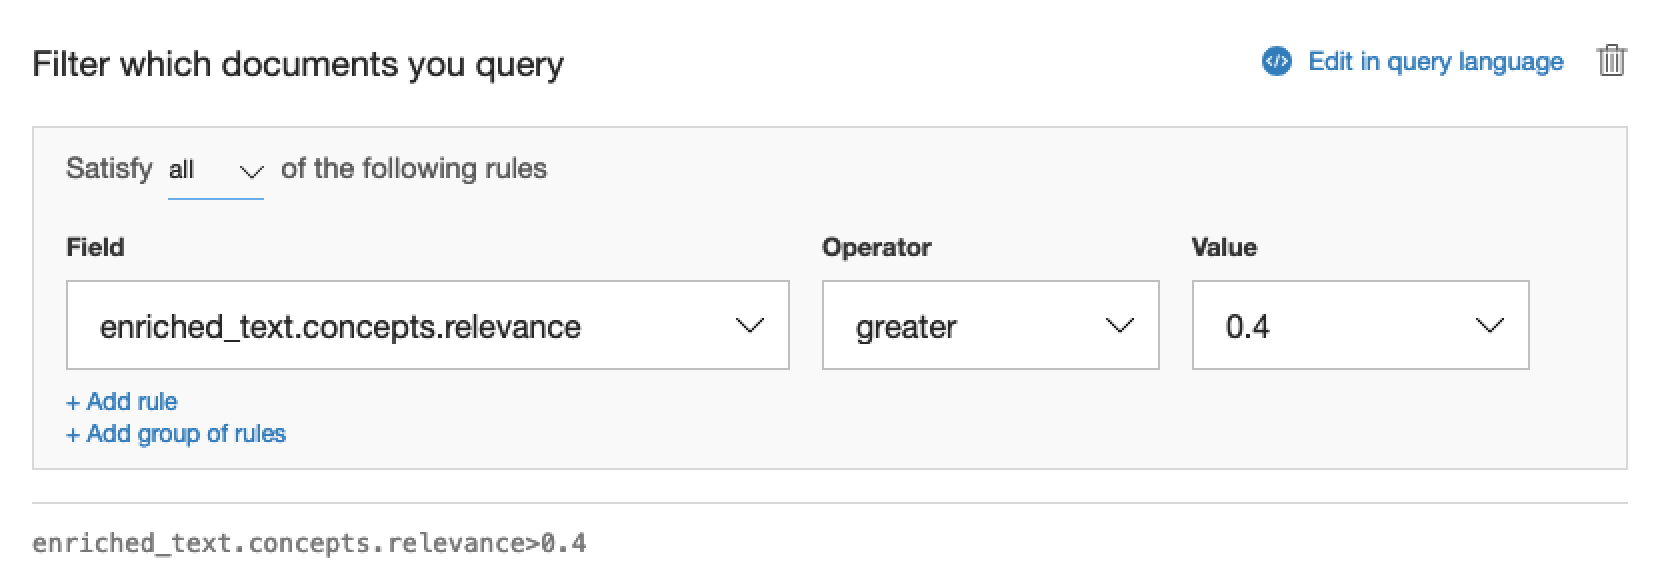
And you should get results that look highlight documents with a relevance greater than 0.4. Possibly something that looks like this.
And that about wraps up how to use Watson Discovery for stock news analysis. This really just scratches the surface of what you can do with Watson Discovery. Where it starts to get really cool is when you start embedding the querying into applications using Node.js but that’s a story for another day.
If you get stuck, drop me a comment below, tweet me @nickrenotte or check out the IBM Query Reference.